The largest cultural study ever conducted in Brazil featuring 19,500 interviews across 27 capitals. The findings have been transformed into interactive dashboards and reports that revealed how socioeconomic factors shape cultural access. Click to see how design turned massive data into nationwide conversation.
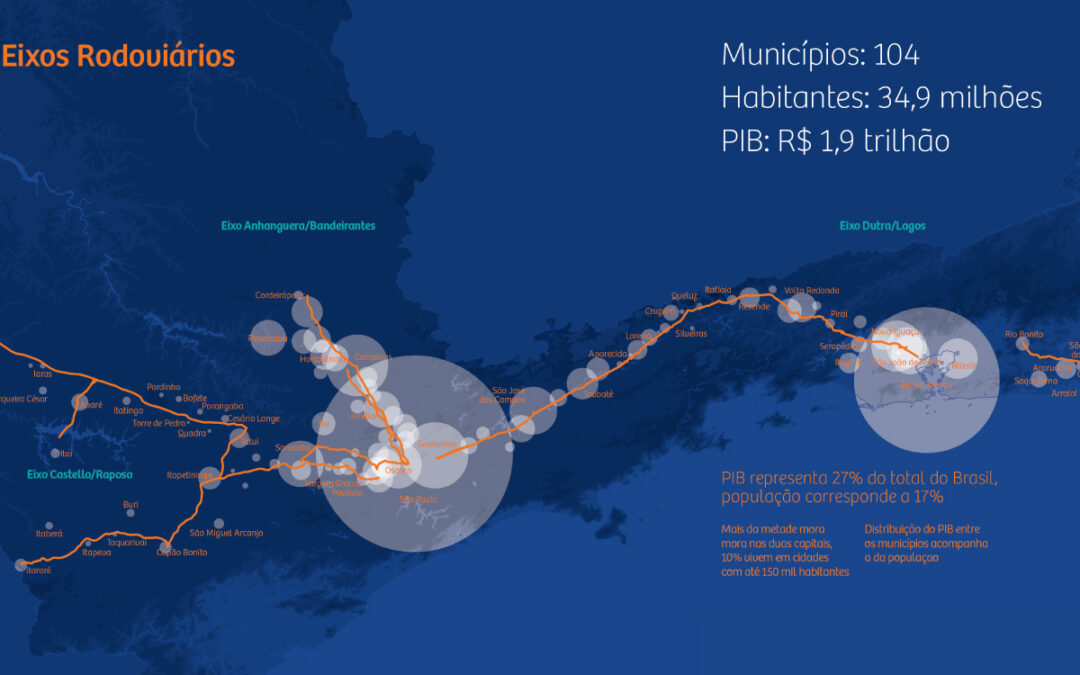
Explore how I visualized cultural infrastructure and public funding across 104 cities along key highways. Using interactive maps and dynamic data tools, this project provided critical insights for policymakers and cultural institutions. Click to dive into the data.
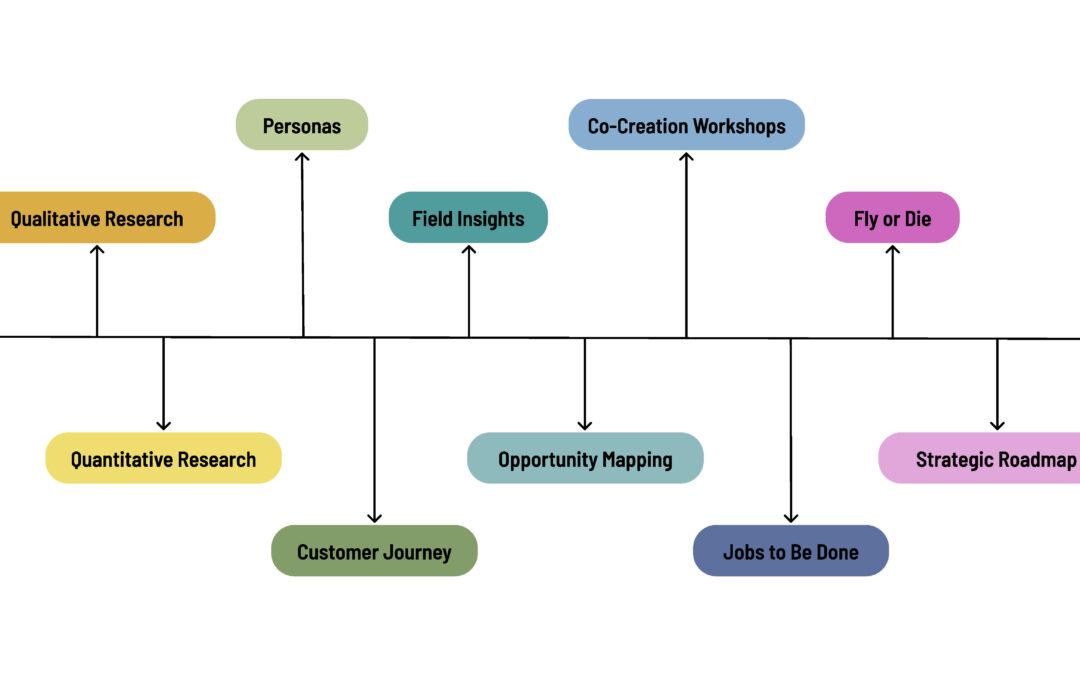
Interactive dashboard integrating qualitative and quantitative insights on driver personas, market trends, and pain points for a leading automotive battery brand. Click to see how design translated complex consumer data into a clear business strategy.
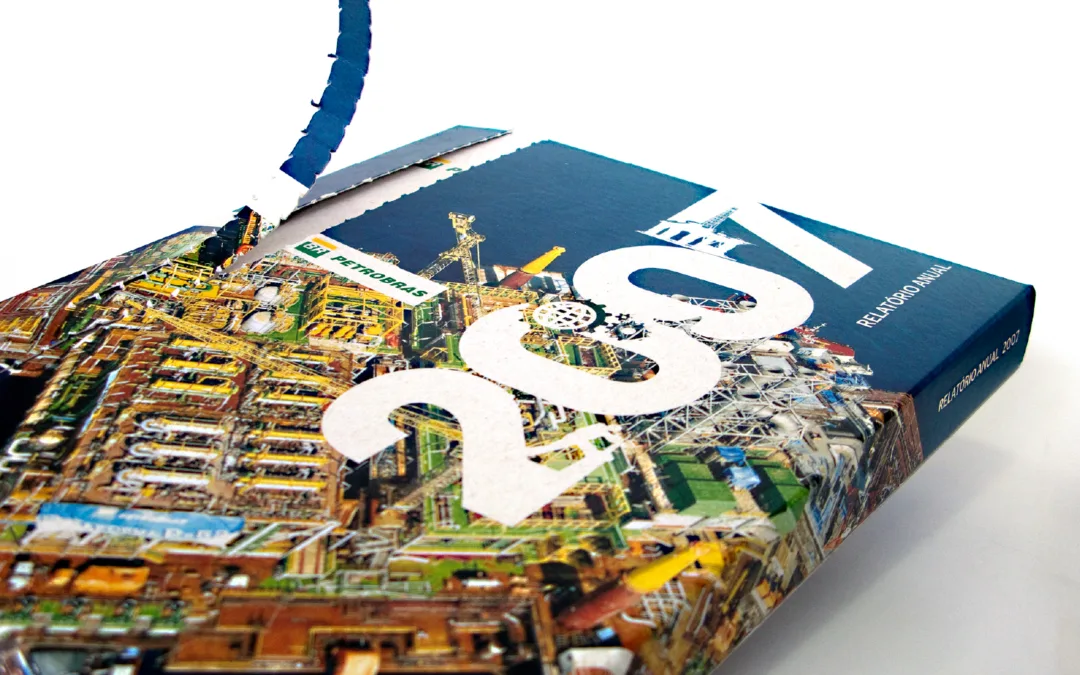
Over the course of two years, I led Petrobras’ corporate annual report communications, spearheading the creation of 25+ tri-lingual products. These included annual reports, interactive sites, and a Braille edition. Our innovative approach not only cut costs by 50× but also earned them global recognition. Click for more.
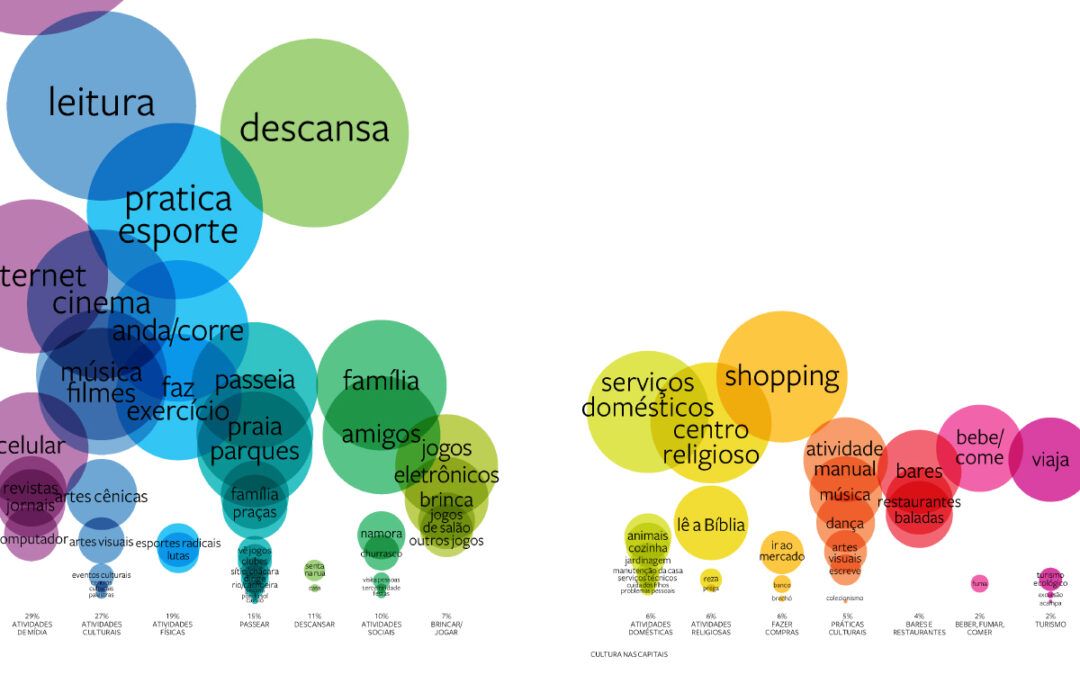
A landmark study of 10,630 interviews across 12 Brazilian capitals, transformed into interactive dashboards and a book of infographics. By shifting from static reports to dynamic data storytelling, it delivered actionable insights for policymakers and institutions. Click to see how design shaped cultural policy and audience development.