Visualizing Cultural Participation: 12 Cities Survey
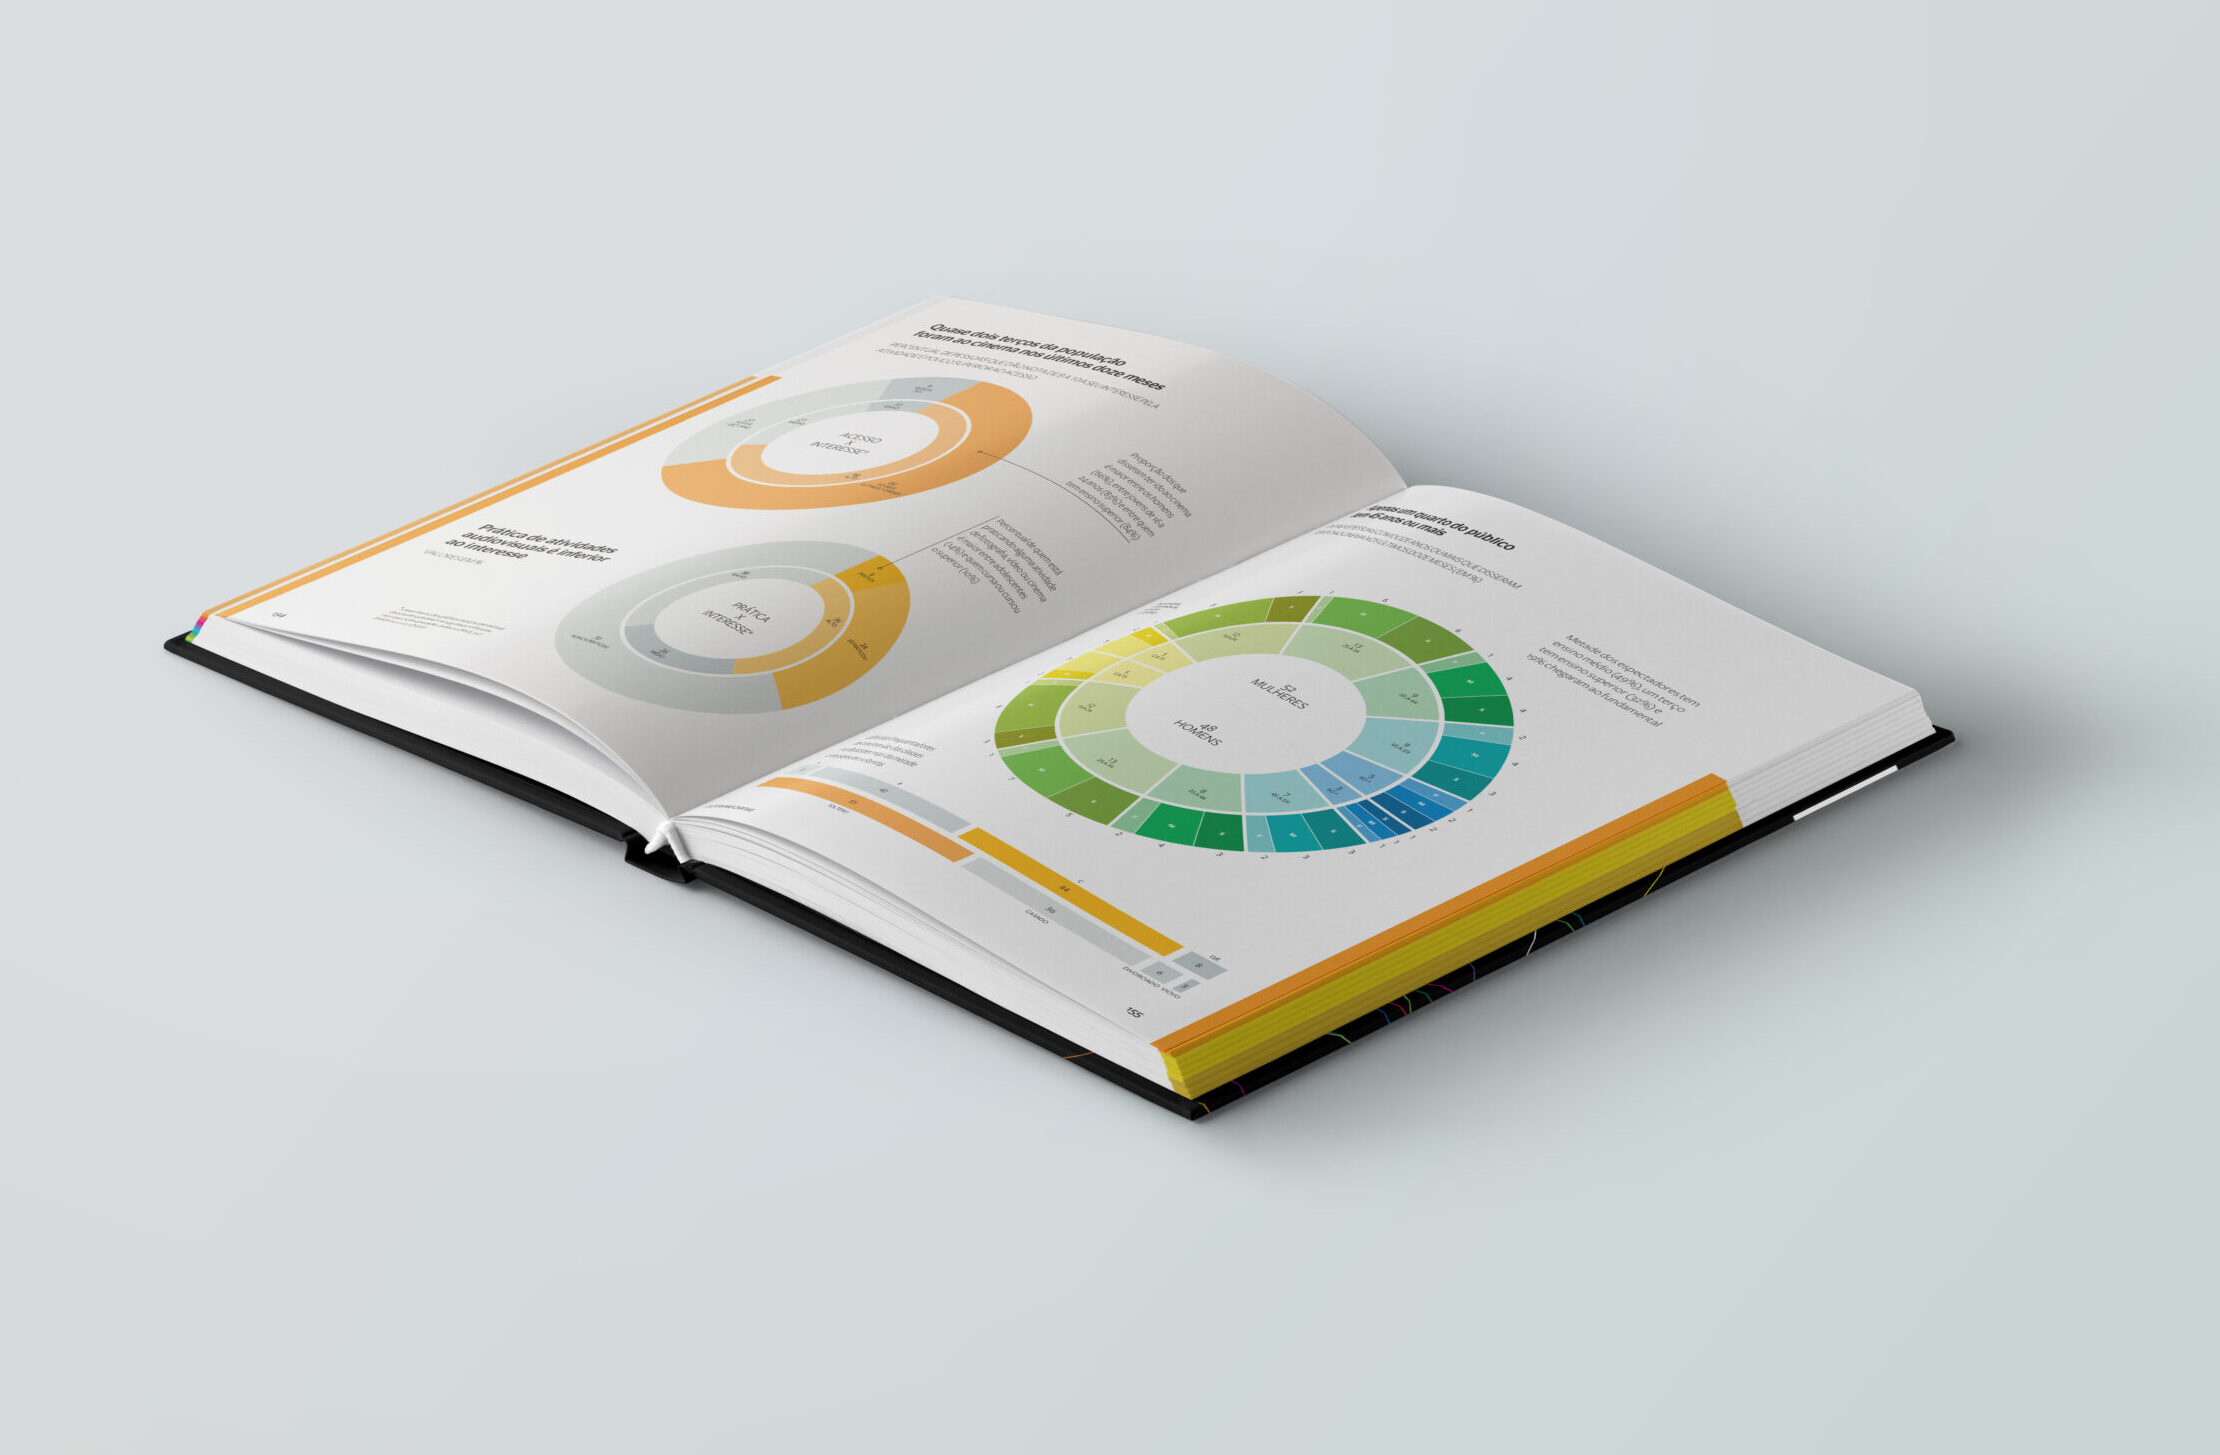
A landmark study of 10,630 interviews across 12 Brazilian capitals, transformed into interactive dashboards and a book of infographics. By shifting from static reports to dynamic data storytelling, it delivered actionable insights for policymakers and institutions. Read More



CHALLENGE
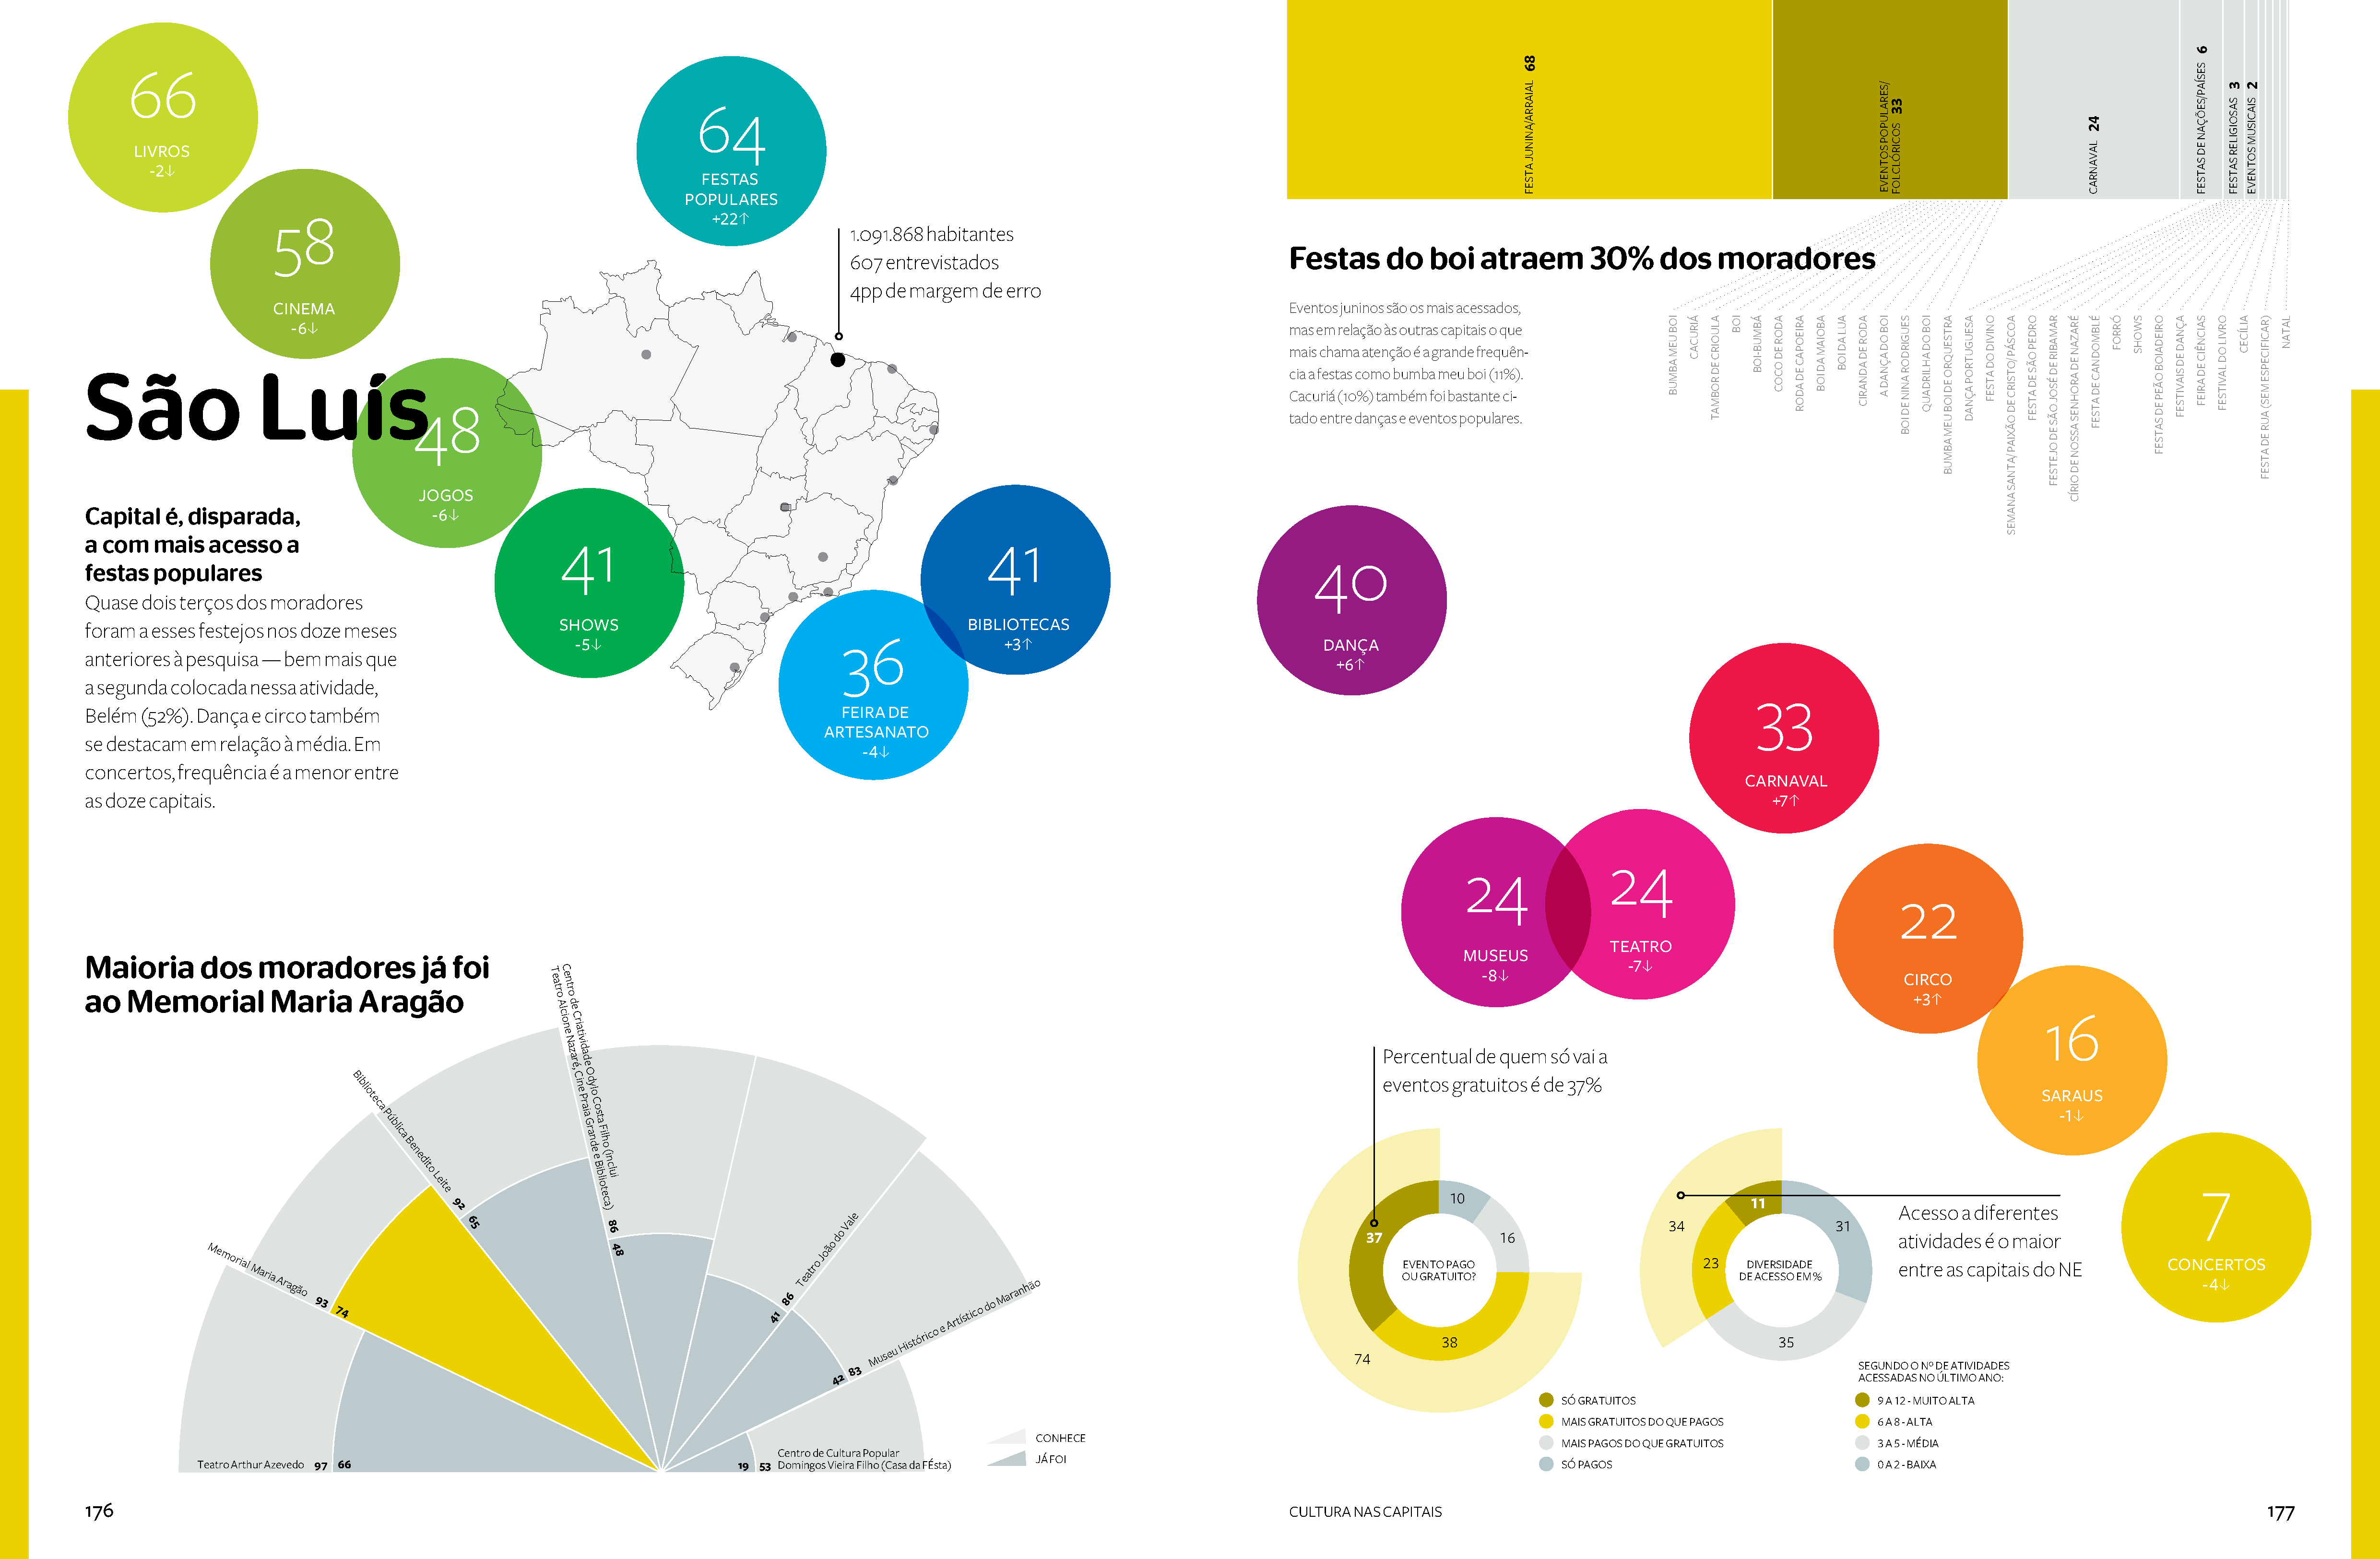
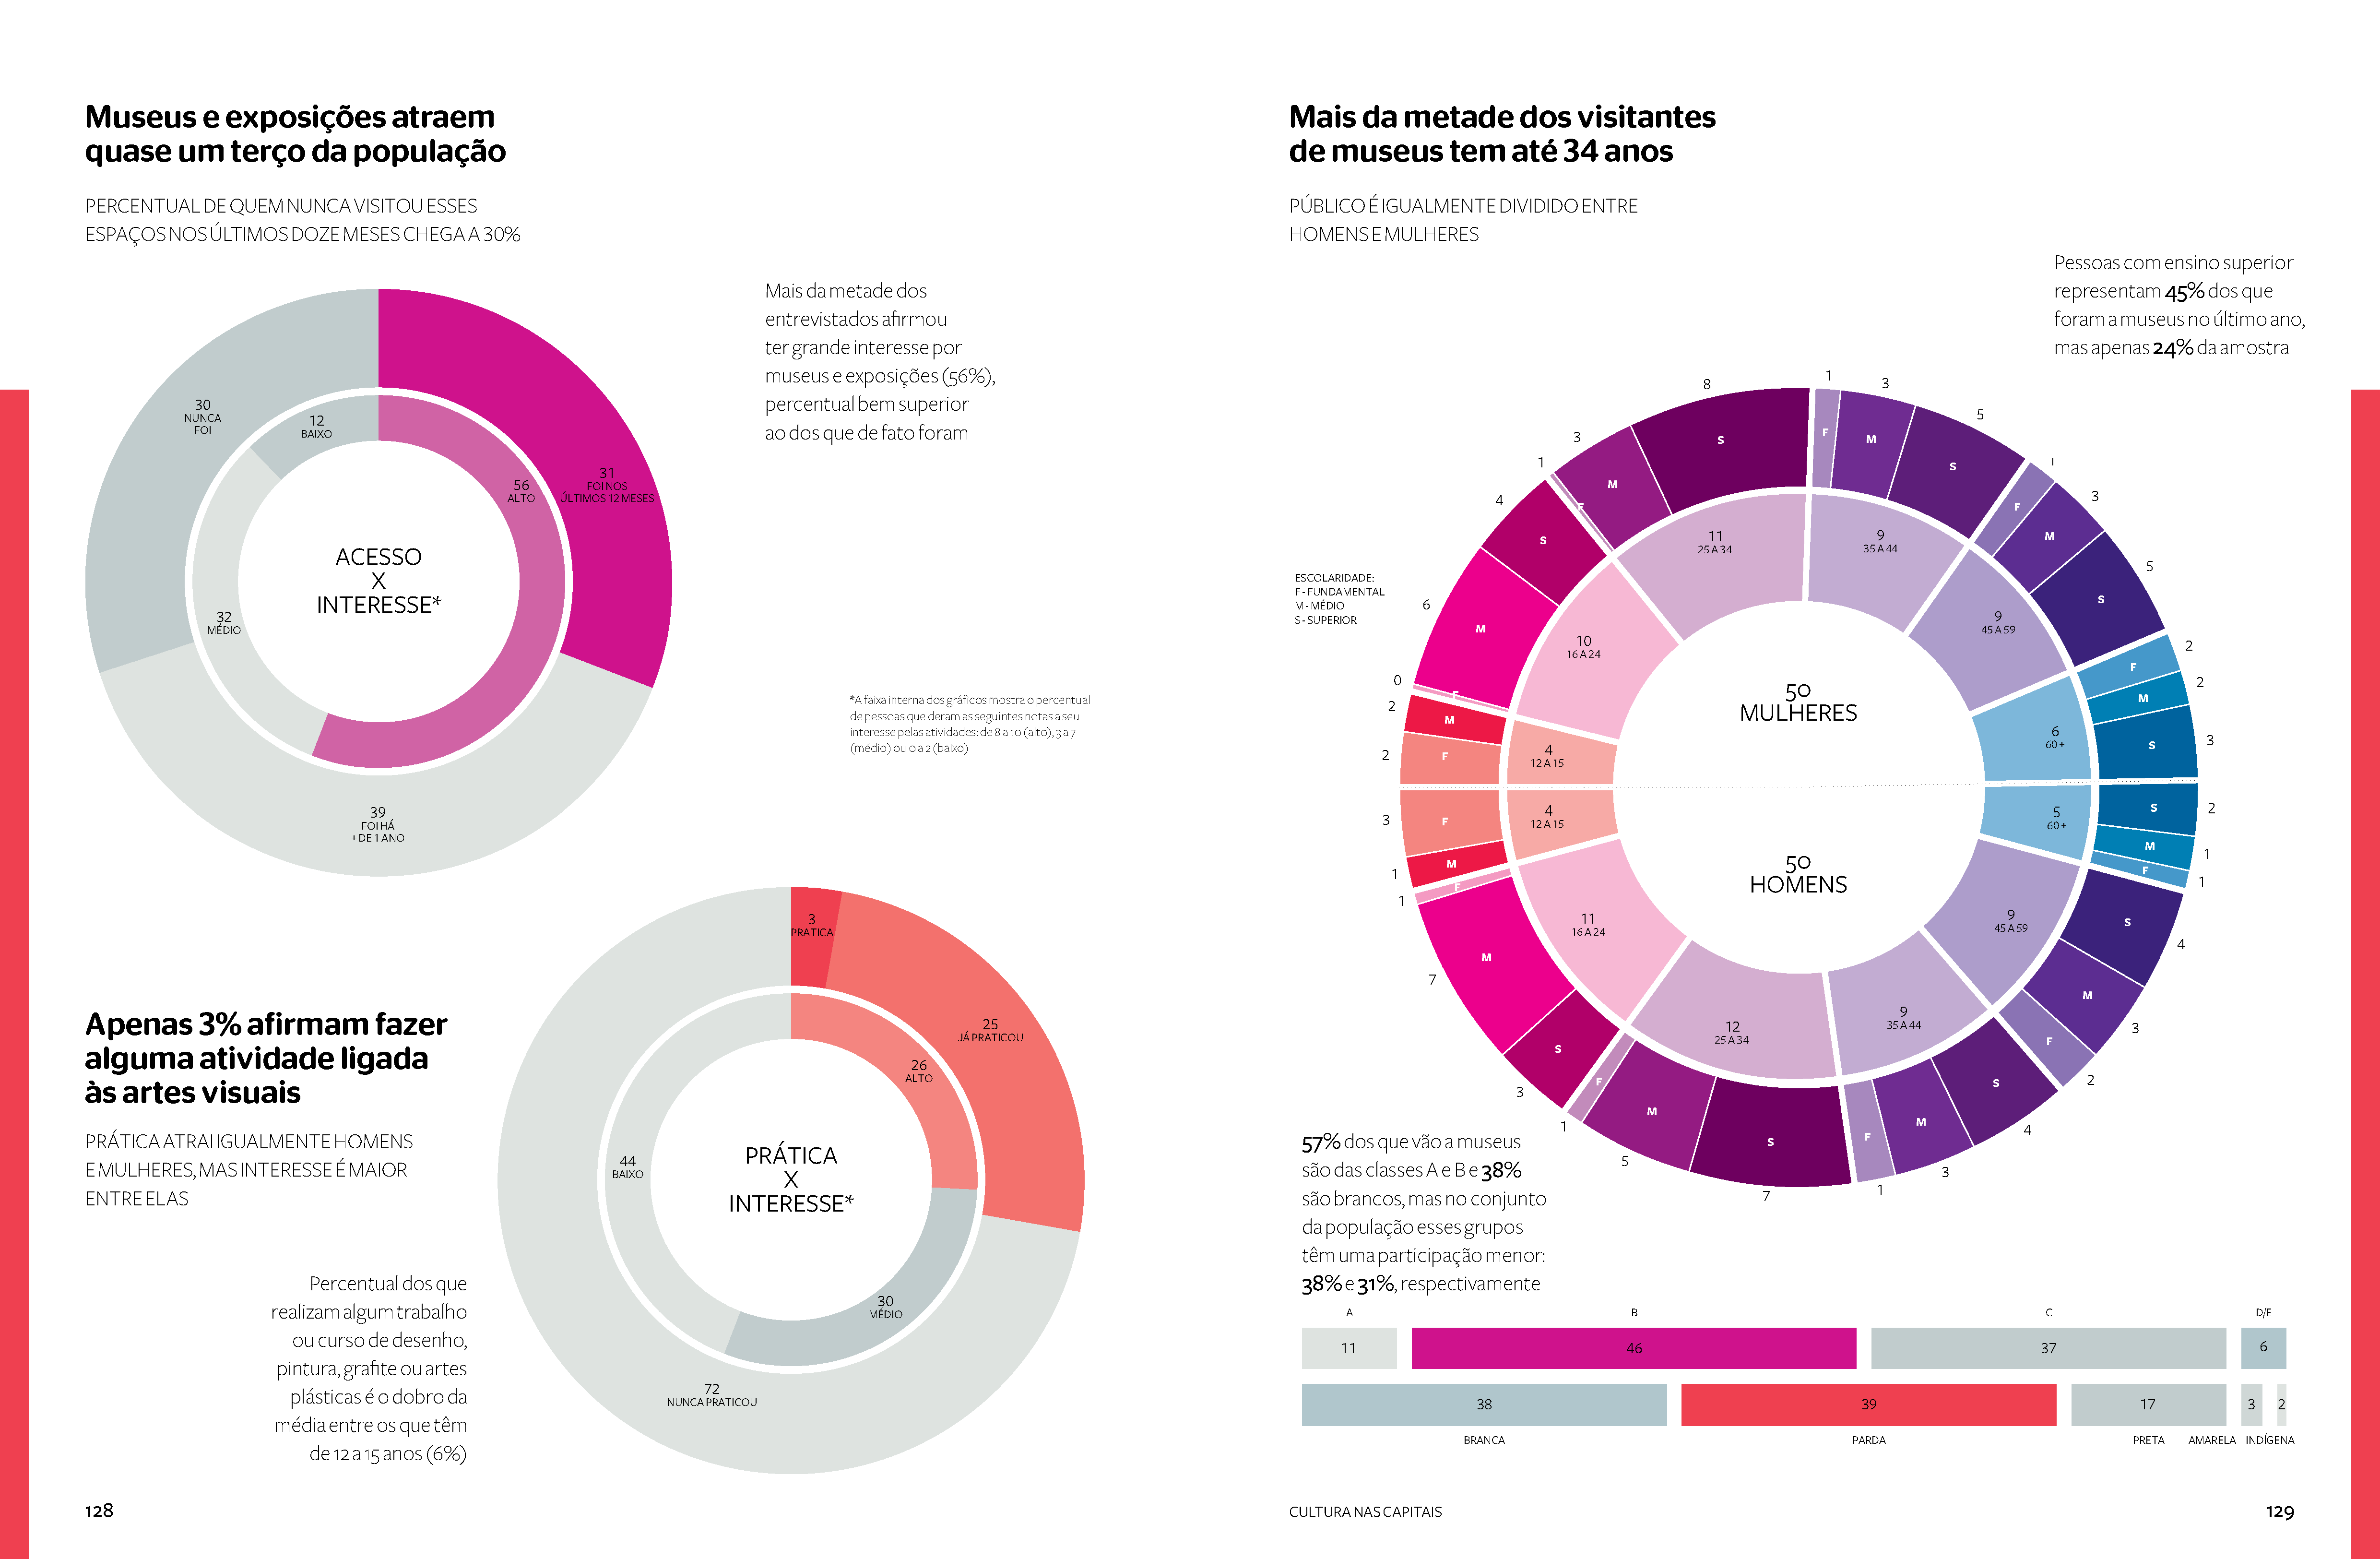
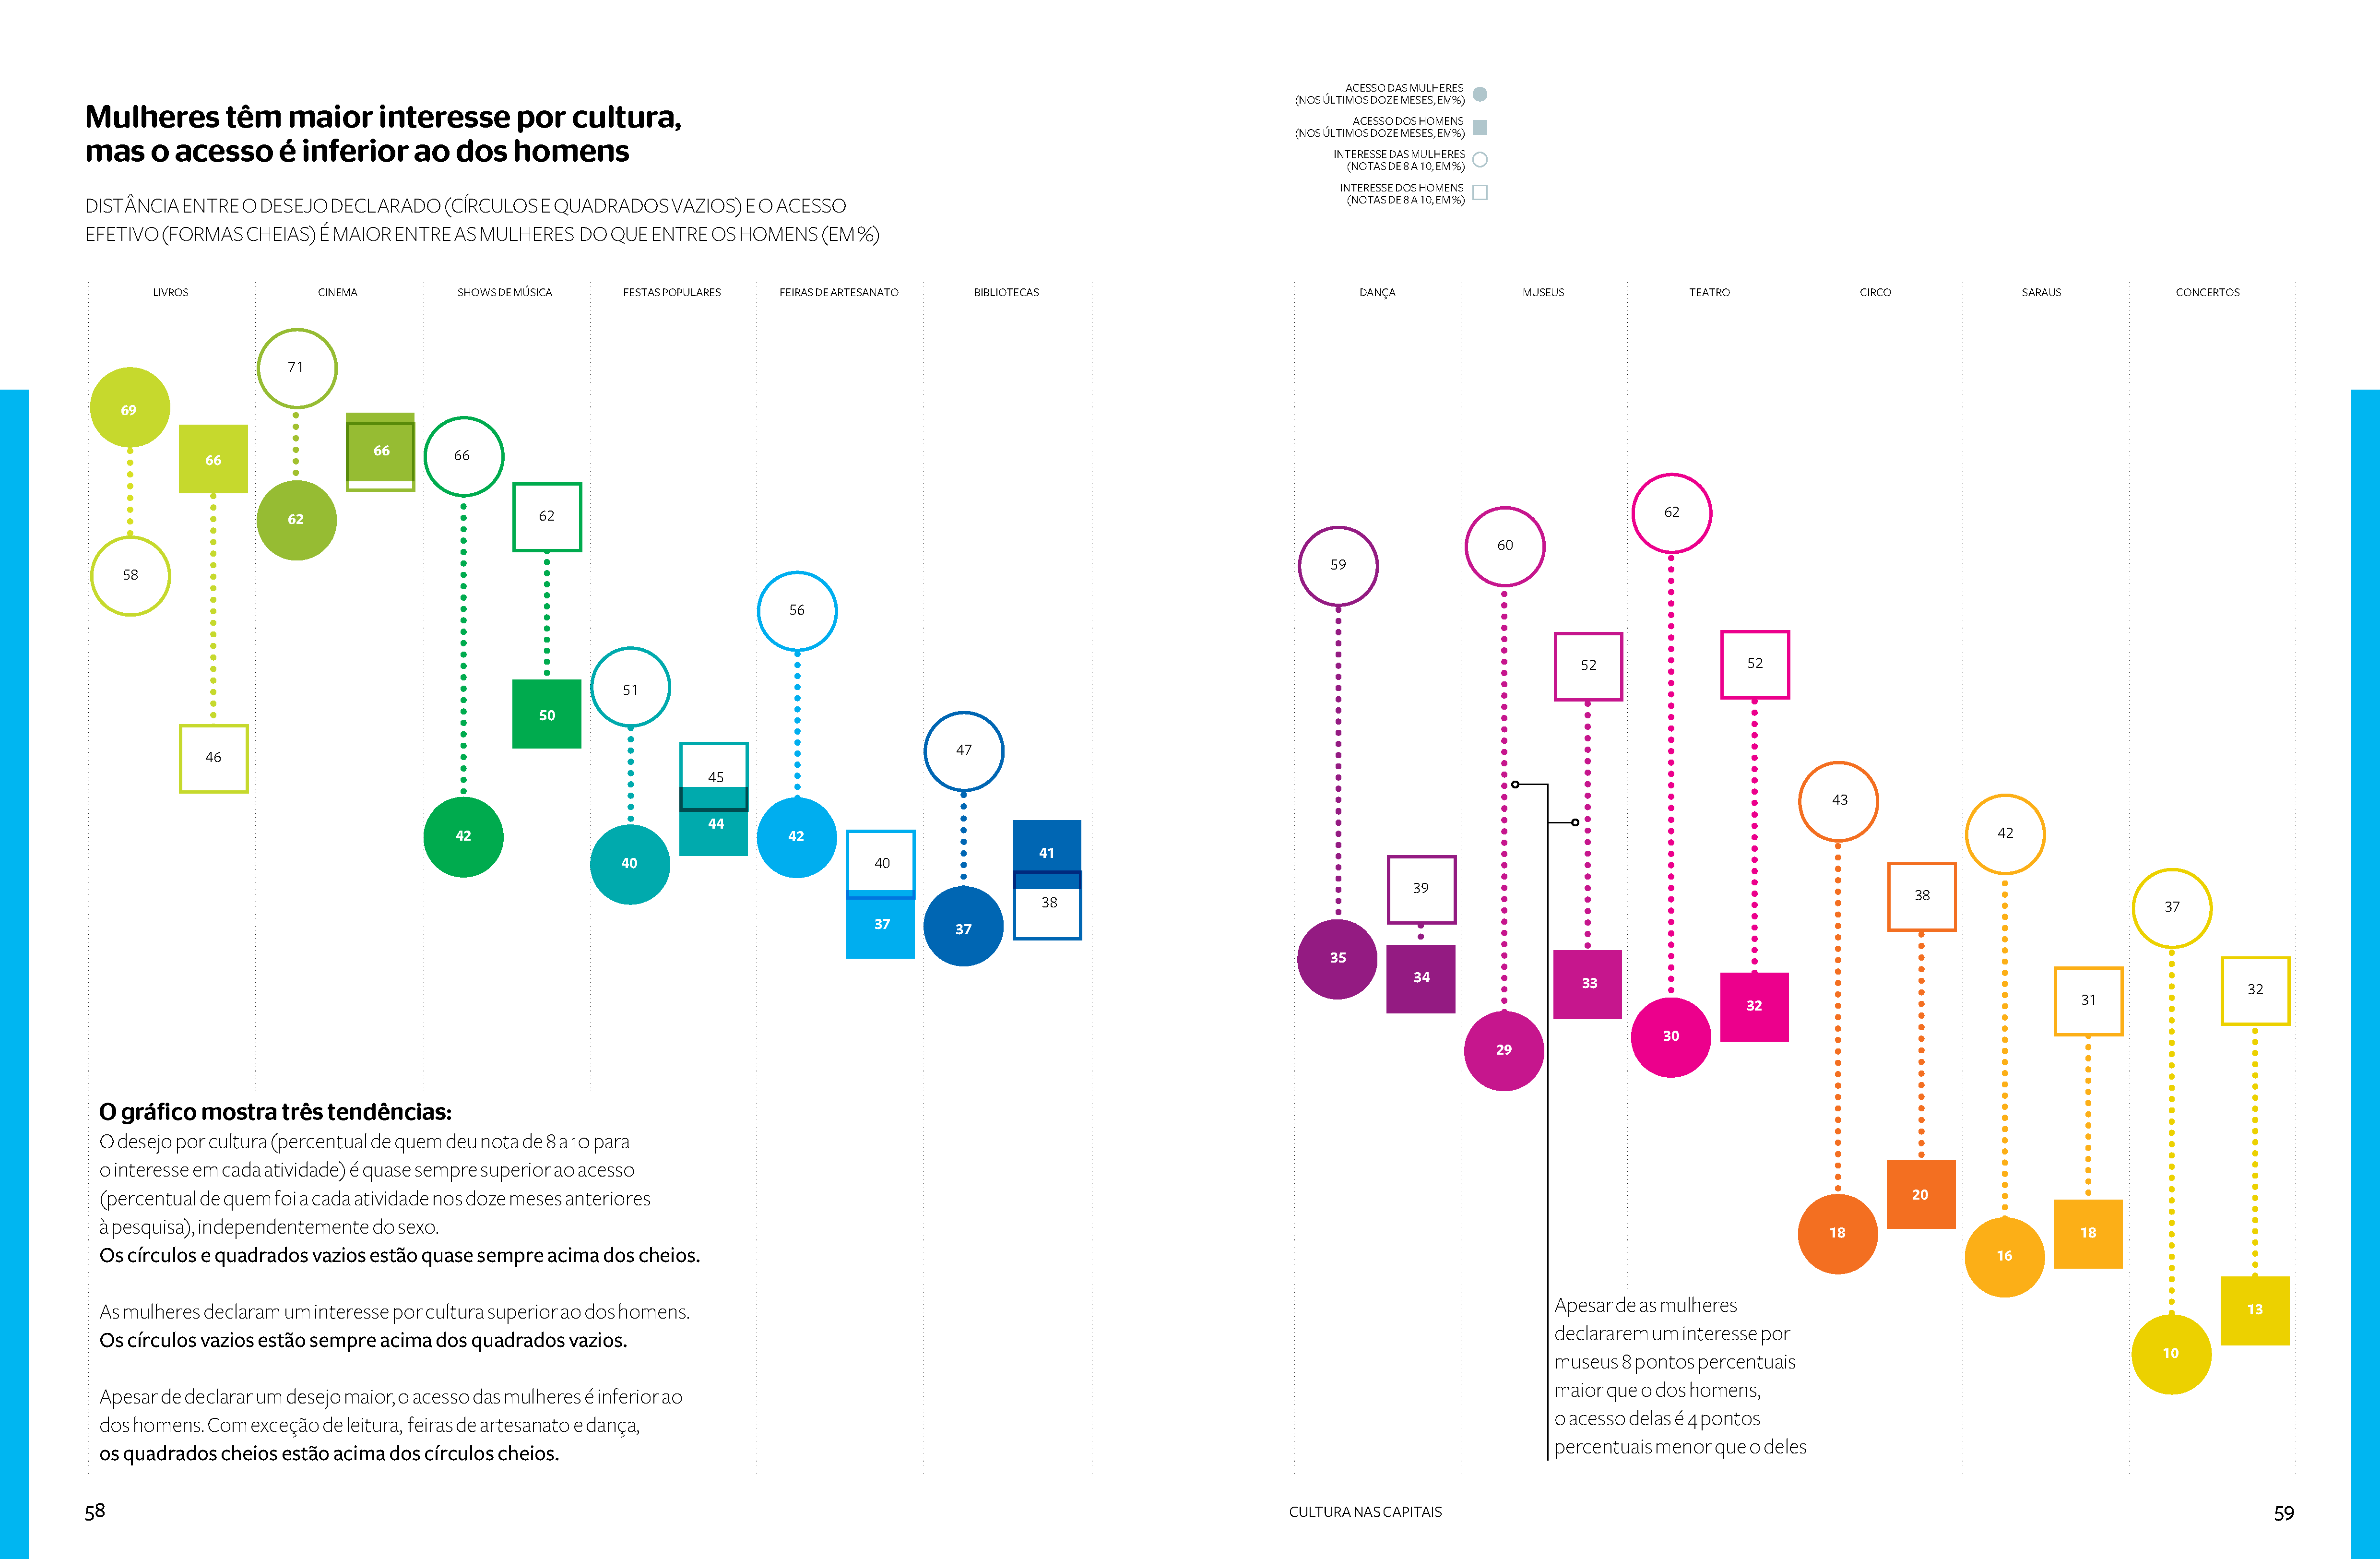
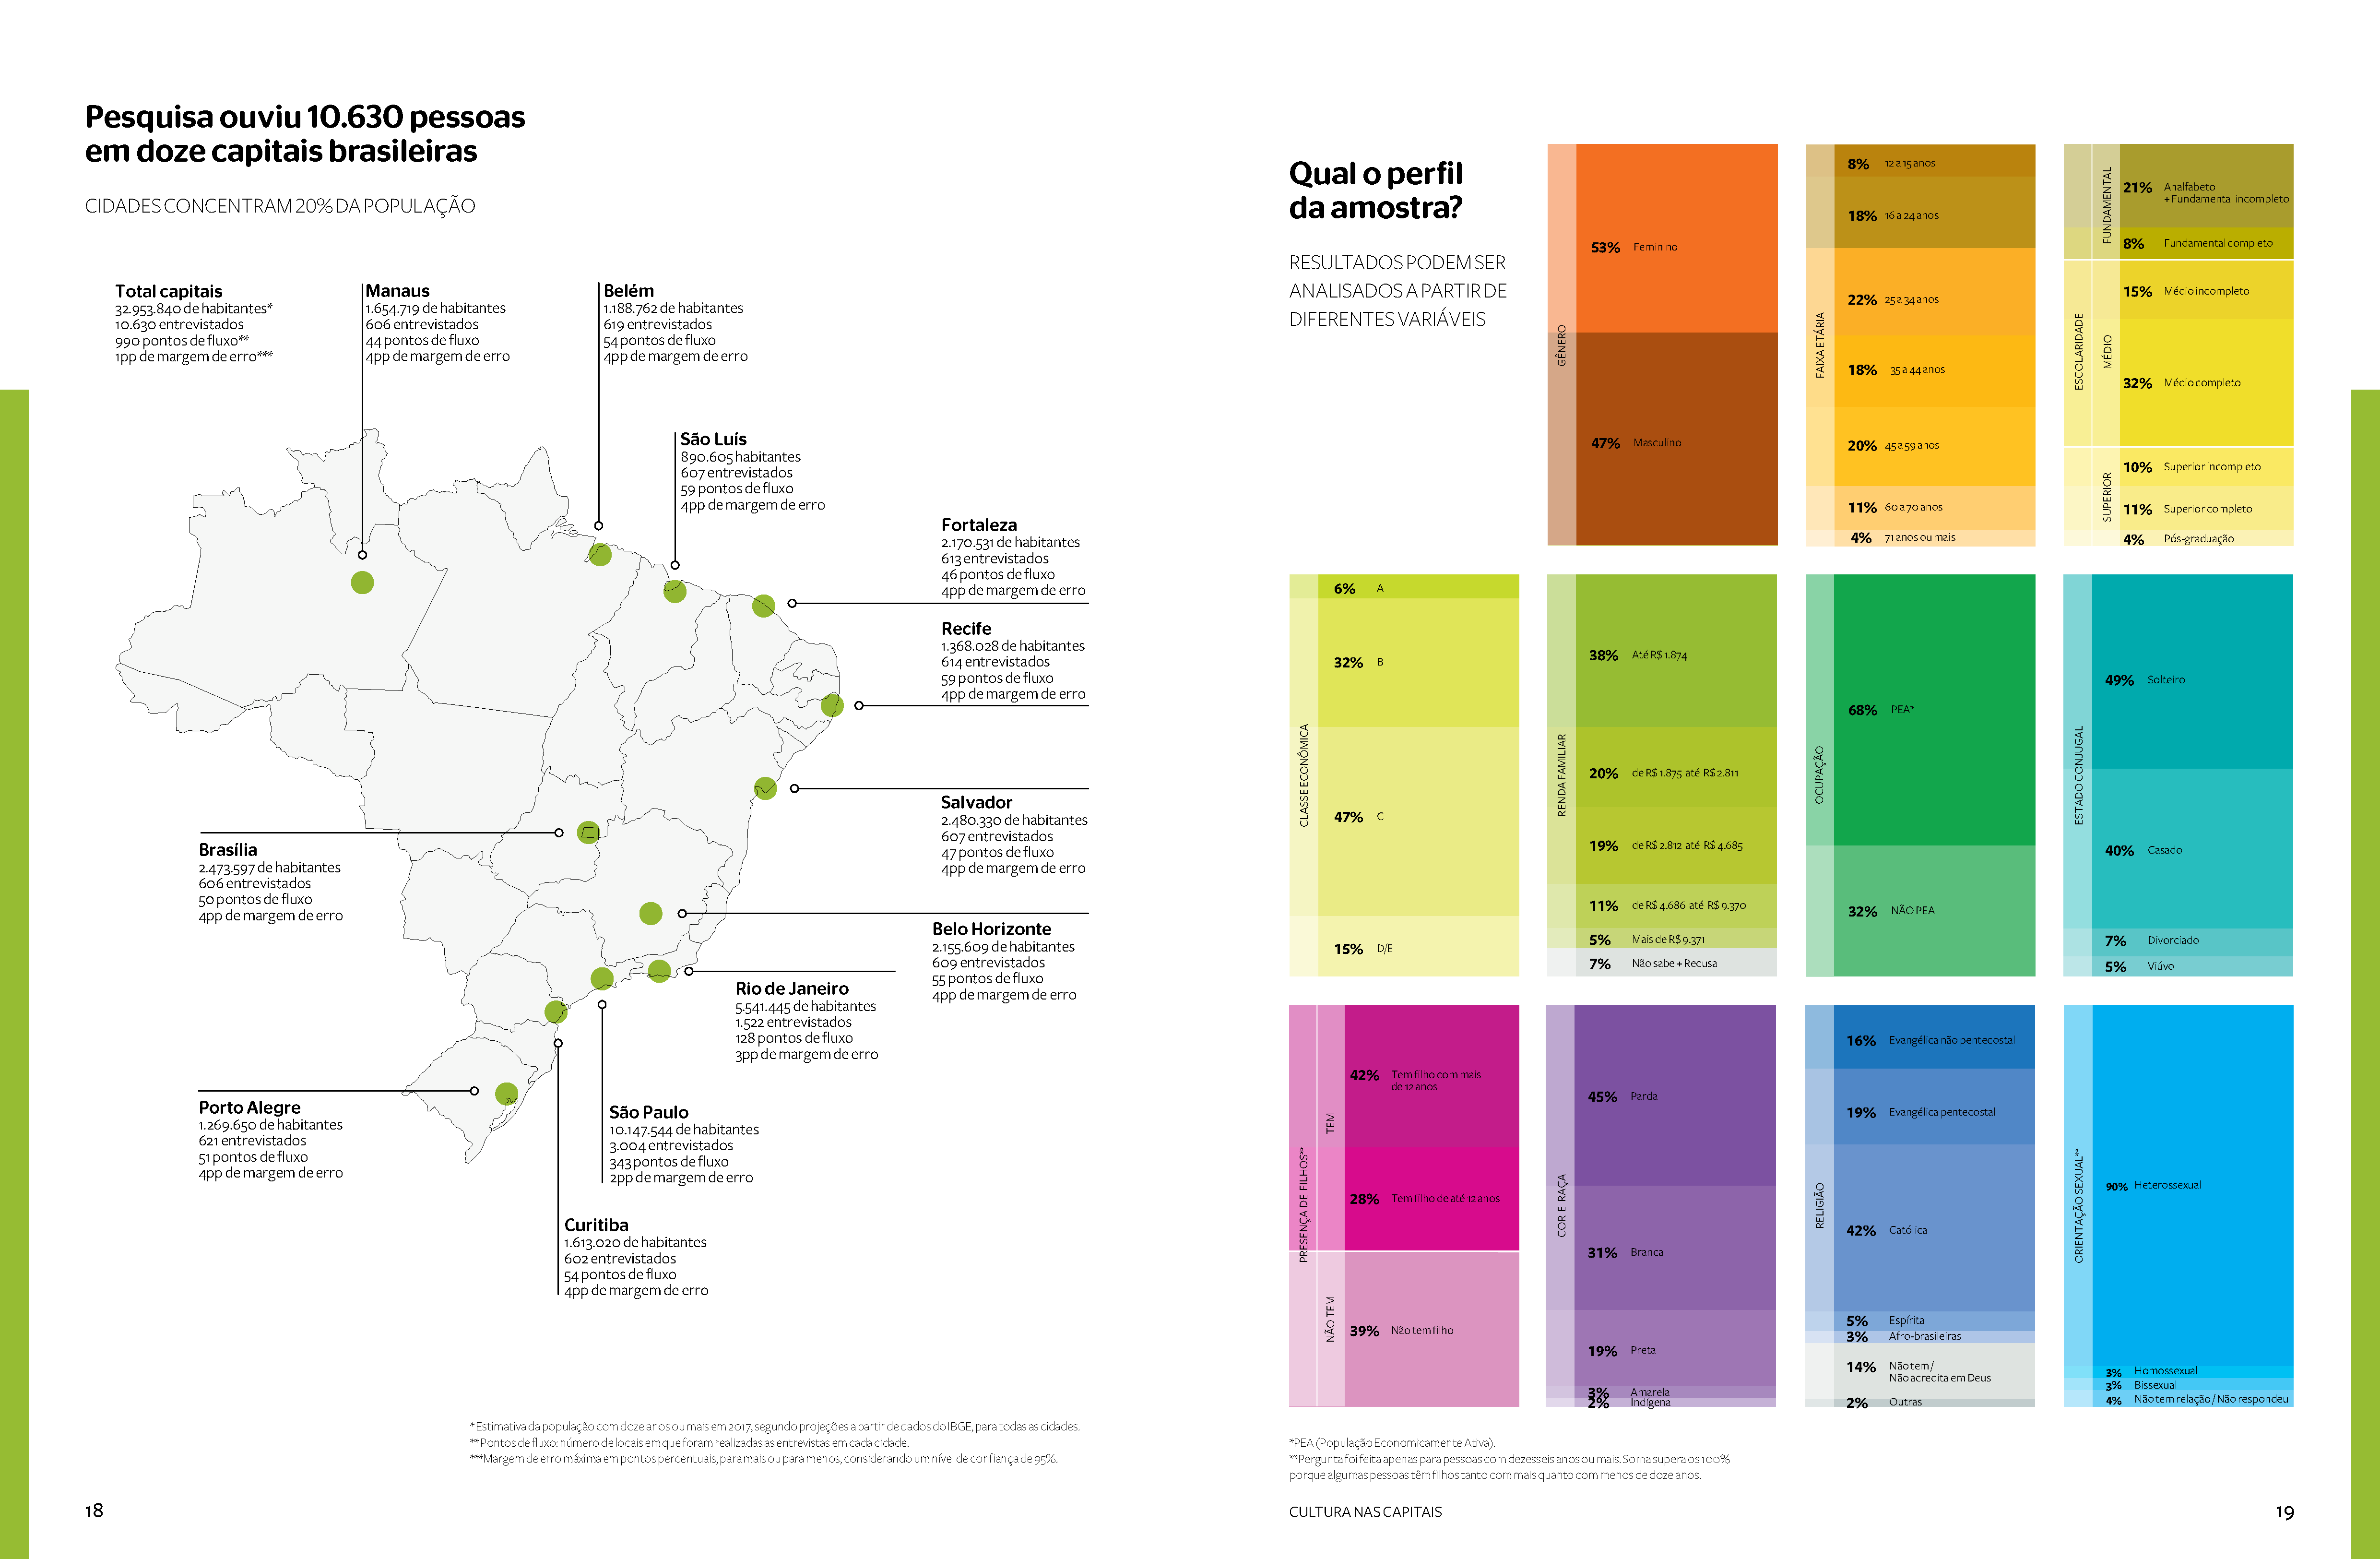
The 2019 Cultura nas Capitais – 12 Cities Study sought to map cultural participation across twelve Brazilian capitals through a comprehensive data-driven approach. The challenge was to translate over 4 million data points from 10,630 interviews into an accessible format that revealed audience engagement patterns across different socioeconomic and demographic segments. The project required a shift from static reports to an interactive, exploratory format that could enhance insights and accessibility.
ROLE
Data Visualization Designer, Project Manager
SOLUTION
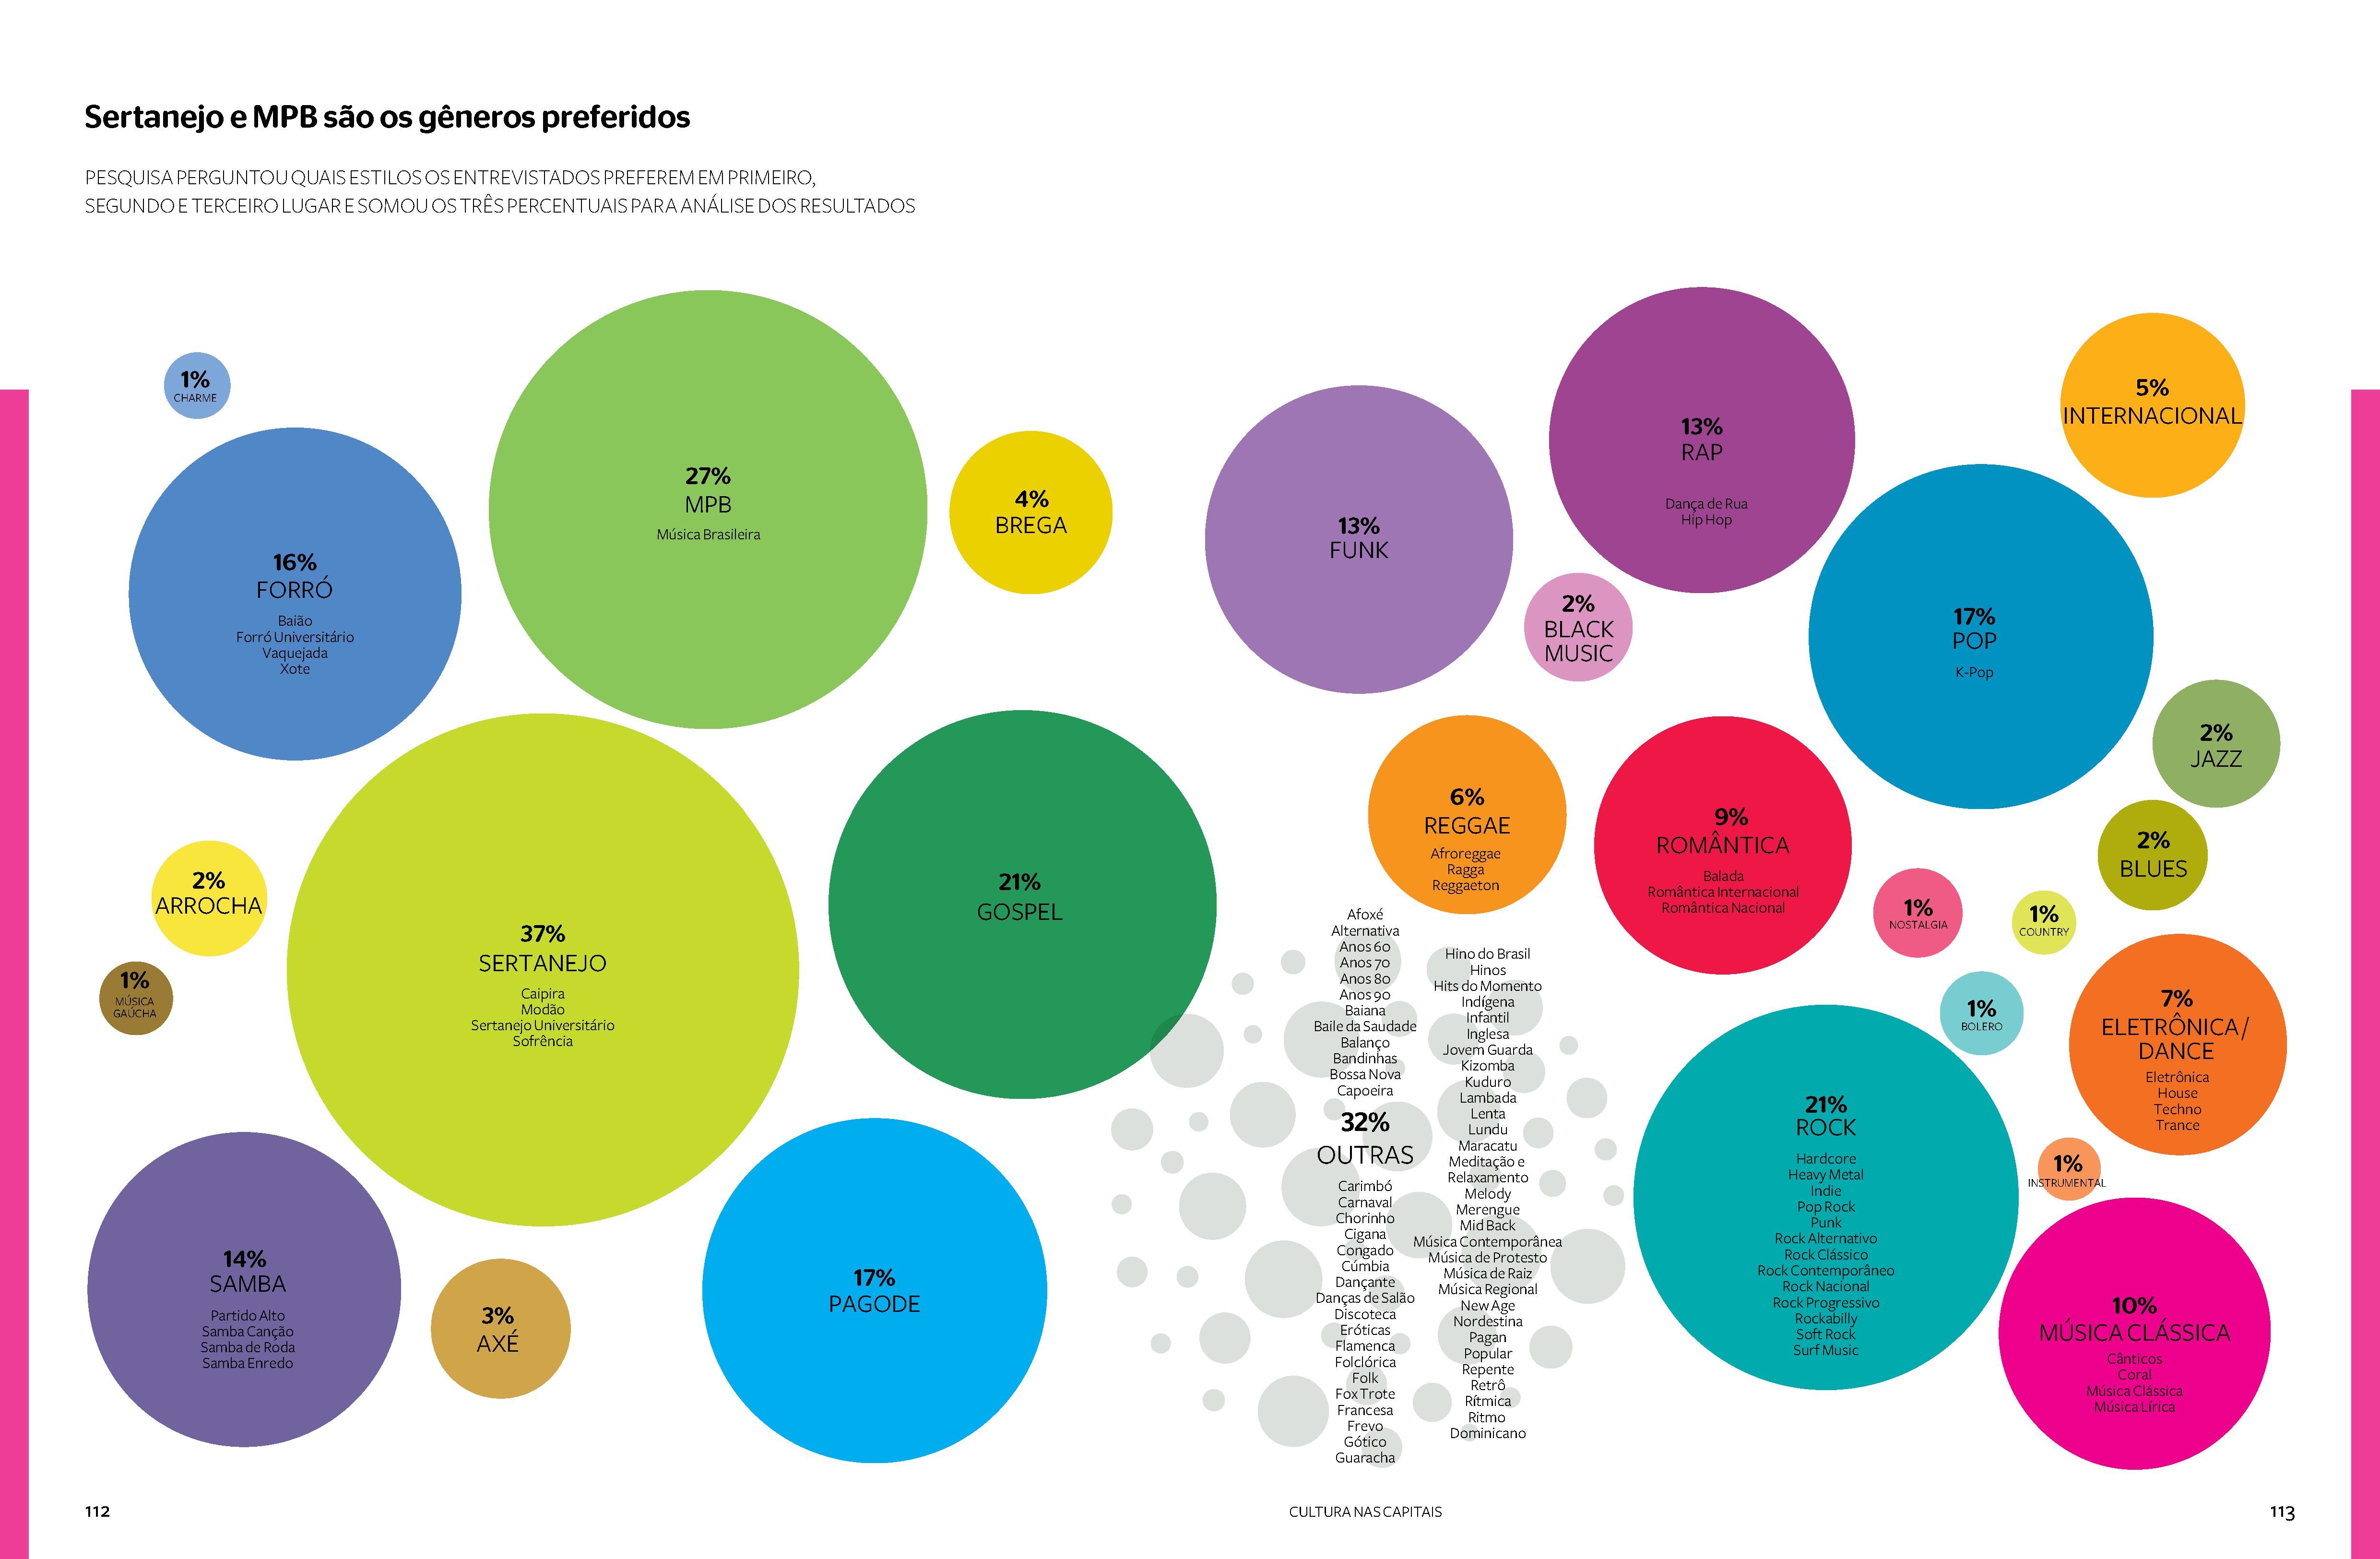
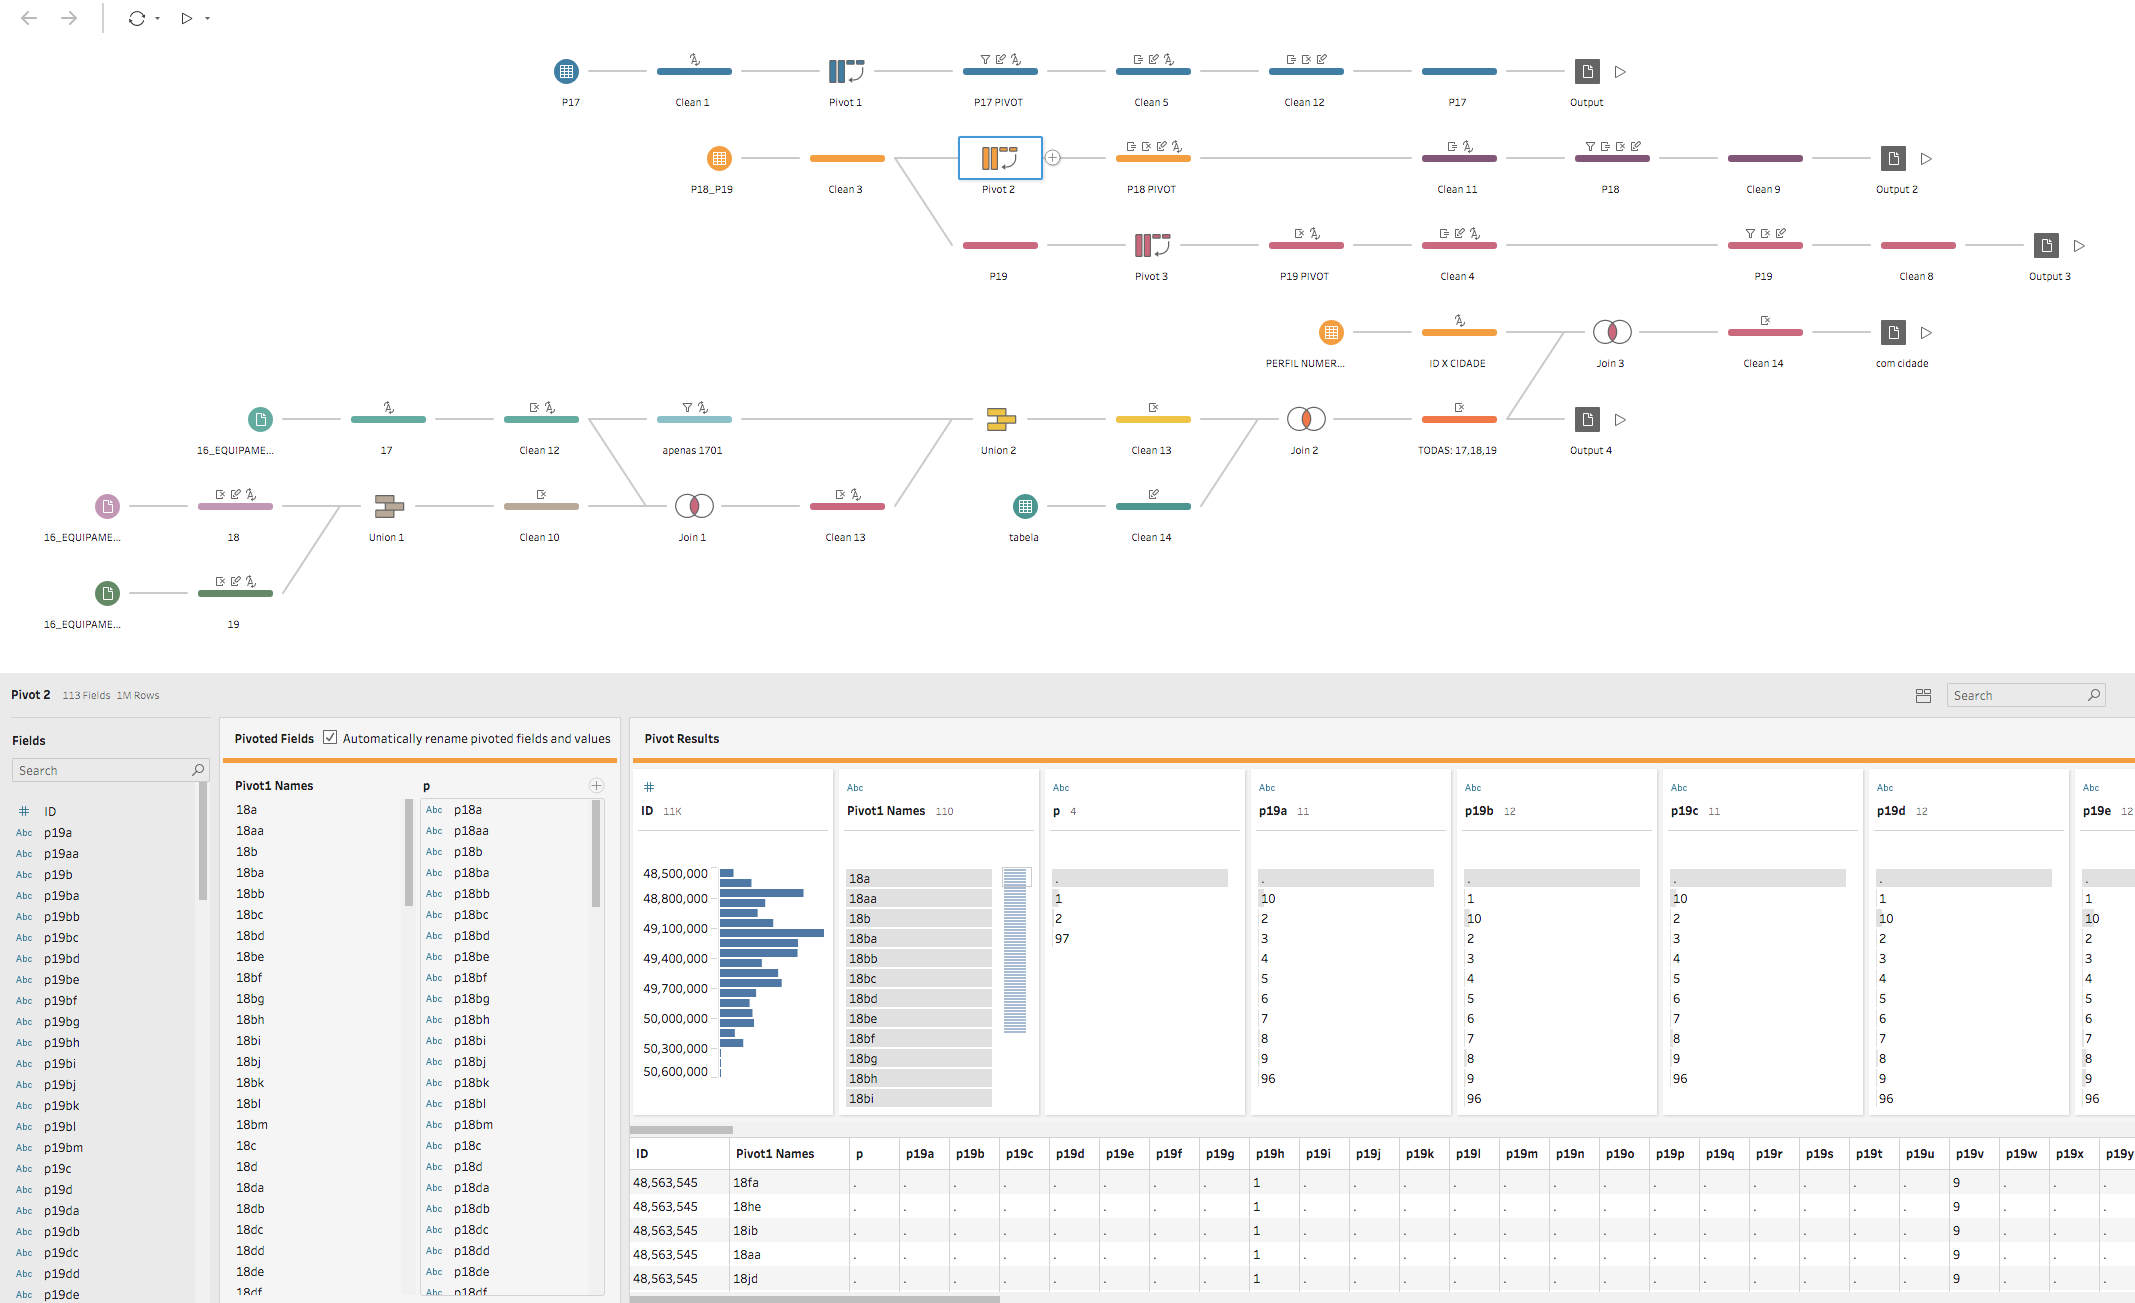
As the Data Visualization Designer, I led the transition from static presentations to dynamic, interactive dashboards using Tableau, making complex data more digestible and actionable. This project marked my first experience in data modeling, where I structured datasets to improve usability while maintaining analytical depth. I collaborated closely with my client, JLeiva, ensuring that the most relevant insights were effectively visualized. The study incorporated infographics and written analyses, enriching the data storytelling and making findings more impactful. By leveraging interactive dashboards, we allowed users to explore cultural habits and access dynamics in a visually compelling and user-friendly format.
IMPACT
The Cultura nas Capitais – 12 Cities Study became a reference point for cultural participation analysis in Brazil, offering actionable insights for policymakers, cultural institutions, and stakeholders. The transition to interactive dashboards significantly improved data accessibility and engagement, enabling dynamic exploration of trends across different social and economic backgrounds. This approach informed strategies to expand cultural access, shaping future research initiatives and influencing policy discussions on audience development.
