Mapping Cultural Engagement: 27 City Survey
Commissioned by Brazil’s Federal Government, Department of Culture, this was the largest cultural engagement survey ever conducted in the country. Based on 19,500 in-person interviews and nearly 500 data points per respondent, the project required structuring a massive dataset into accessible insights for policymakers, researchers, and cultural institutions. I developed a comprehensive data visualization system, including ETL, data modeling, and interactive dashboards, as well as reports and presentations that fostered national discussions on access, investment, and cultural policy. Read More
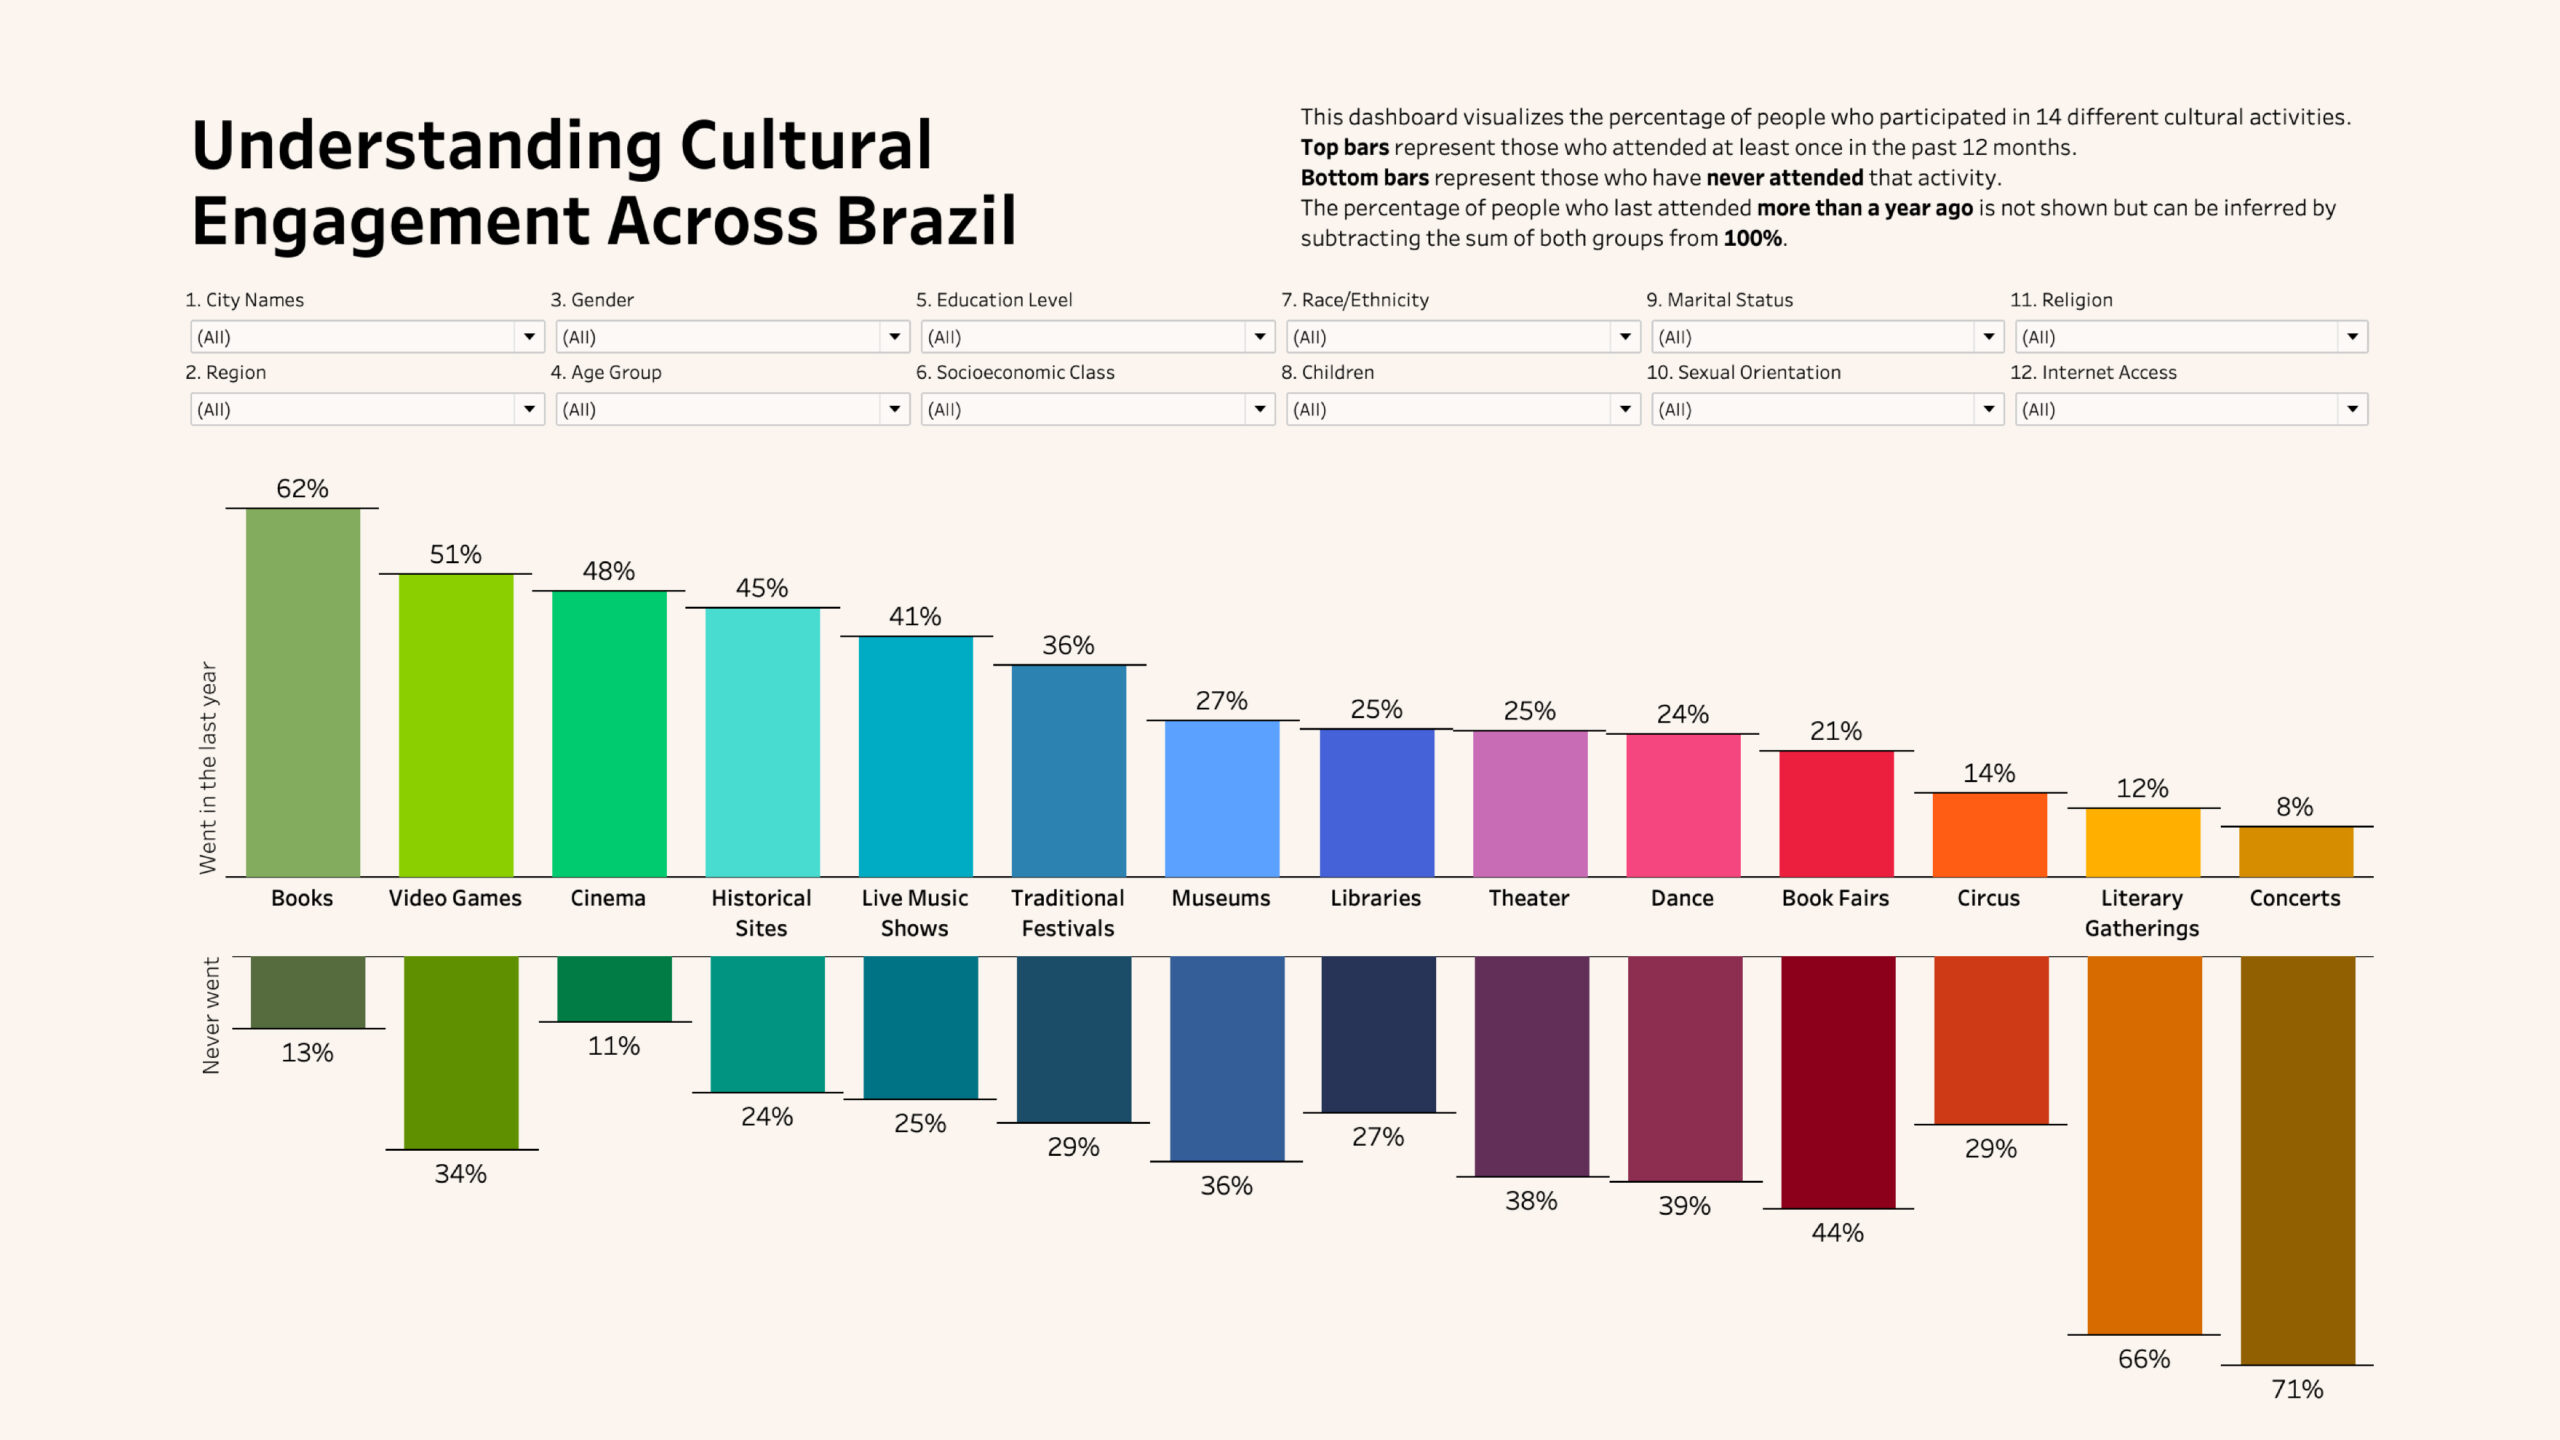
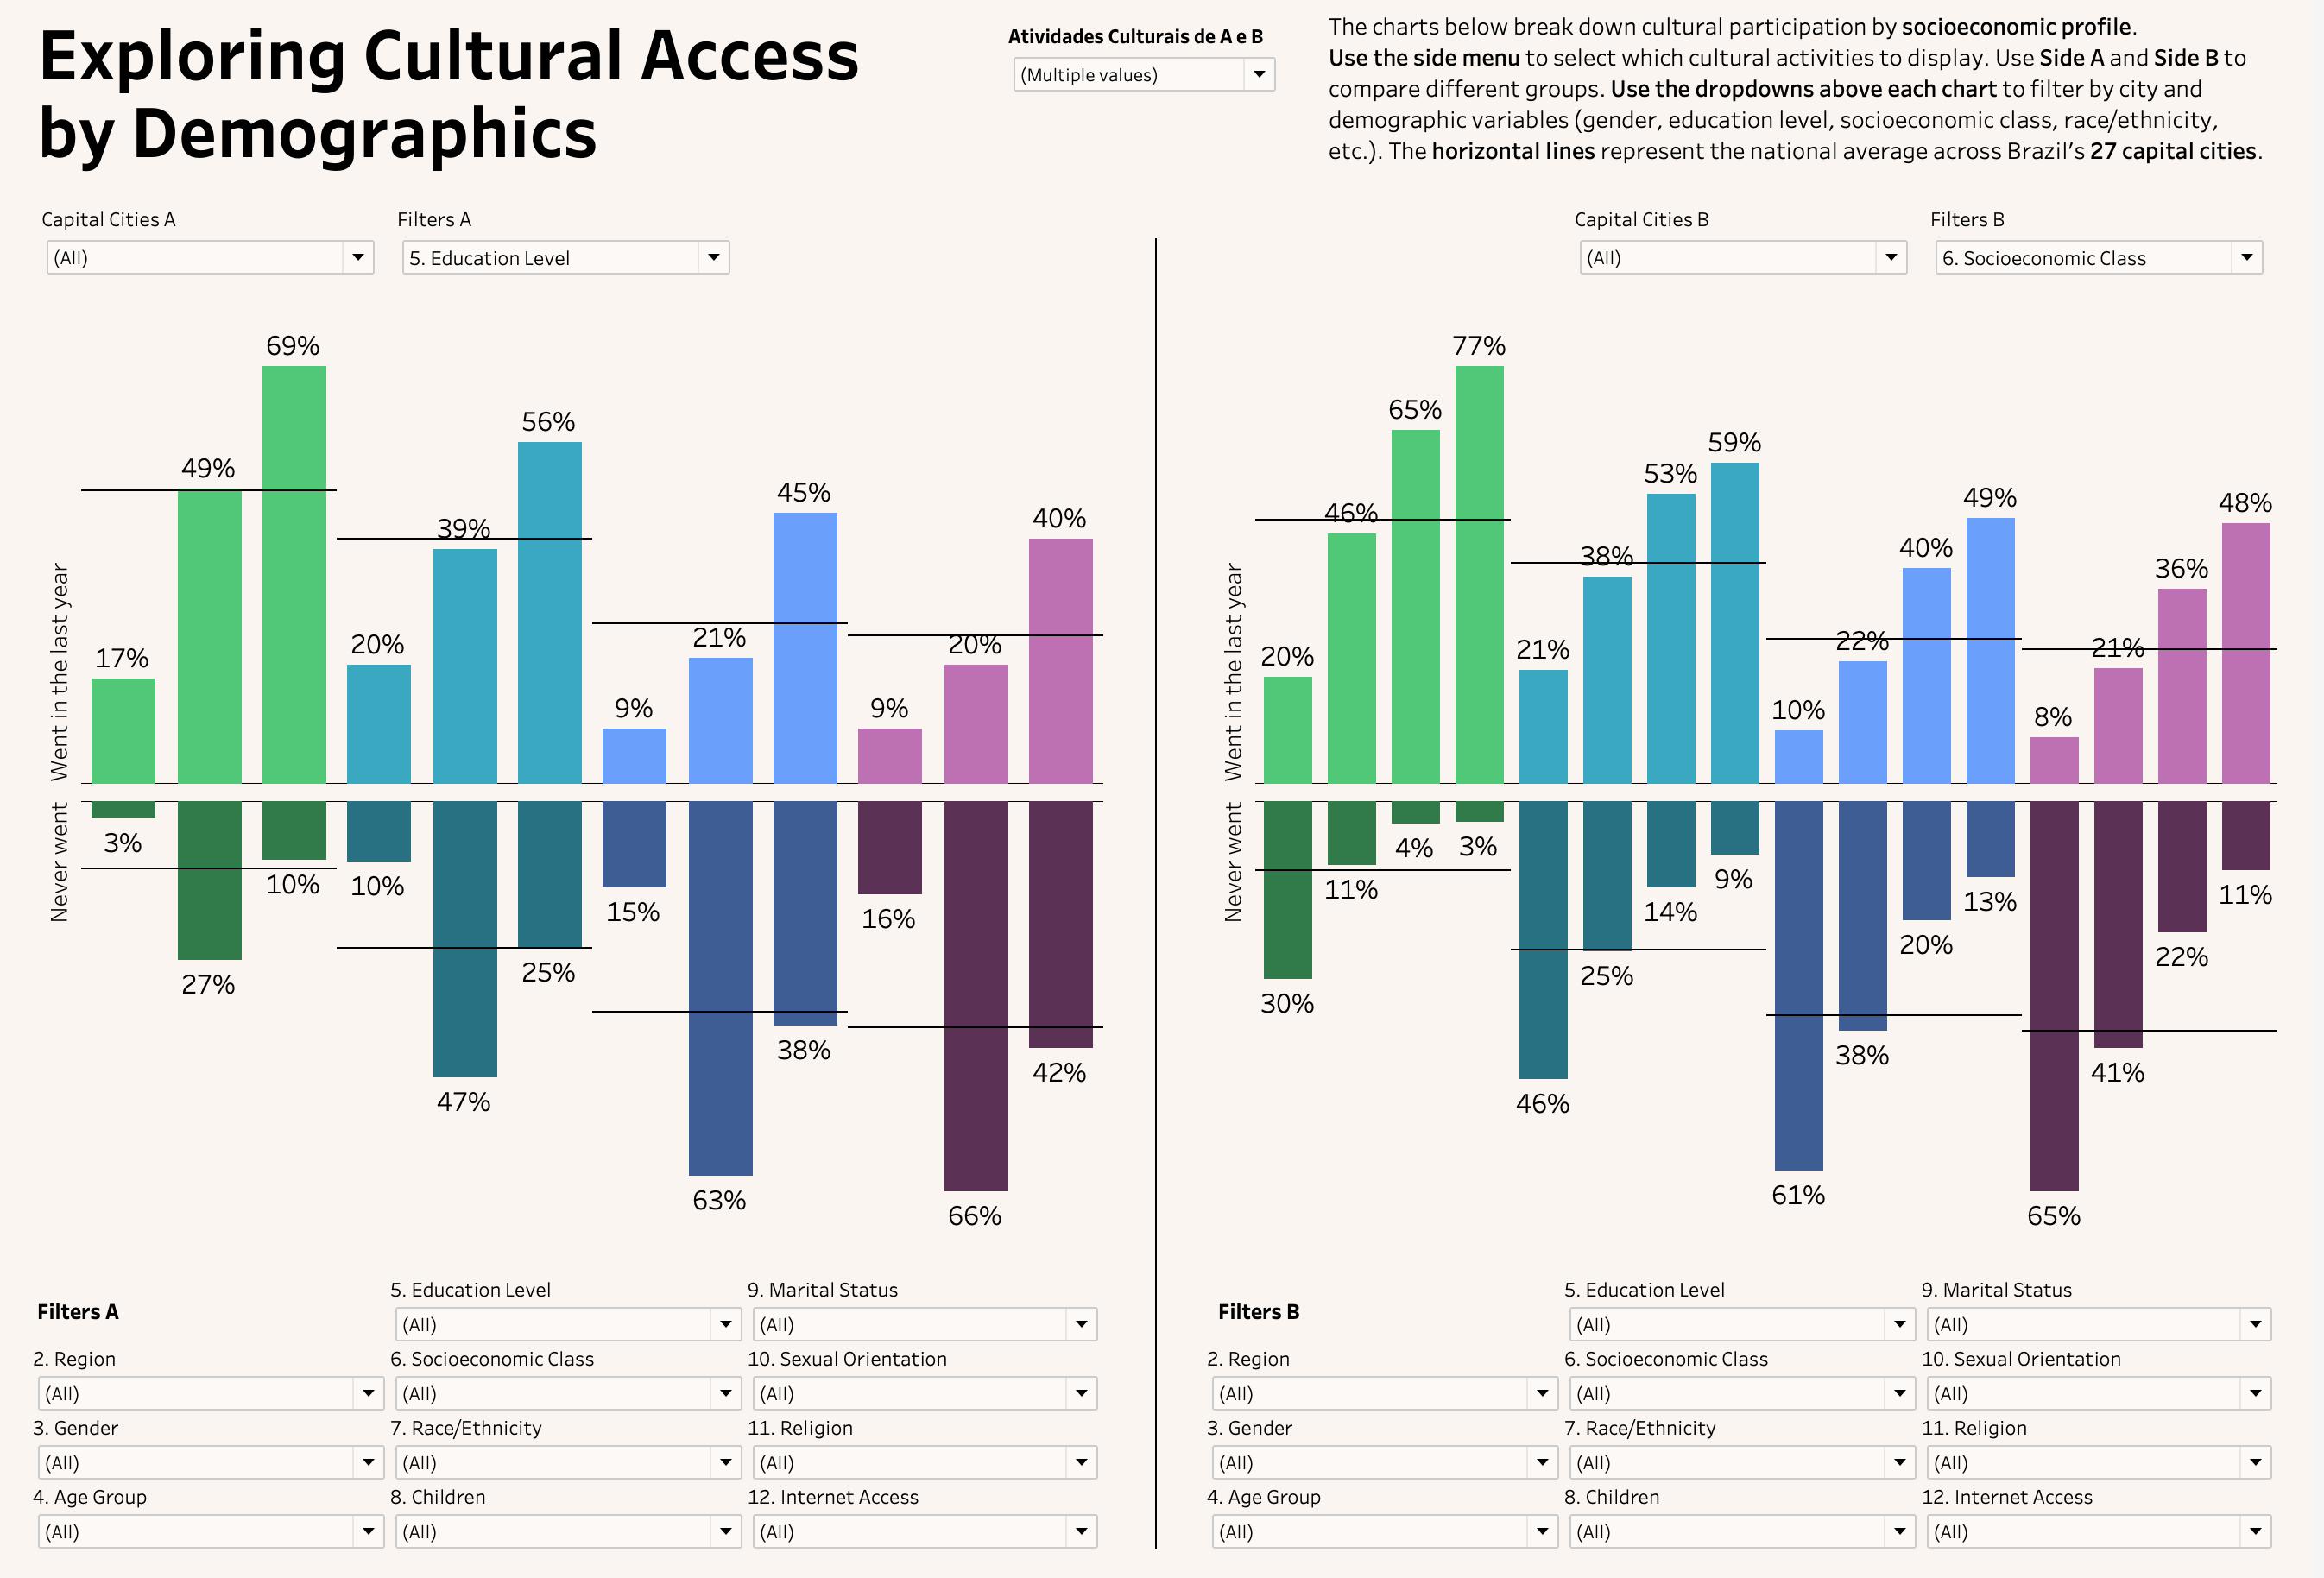
The comparative dashboard view enables users to analyze cultural engagement by activity across different cities or compare demographic profiles within the same city.
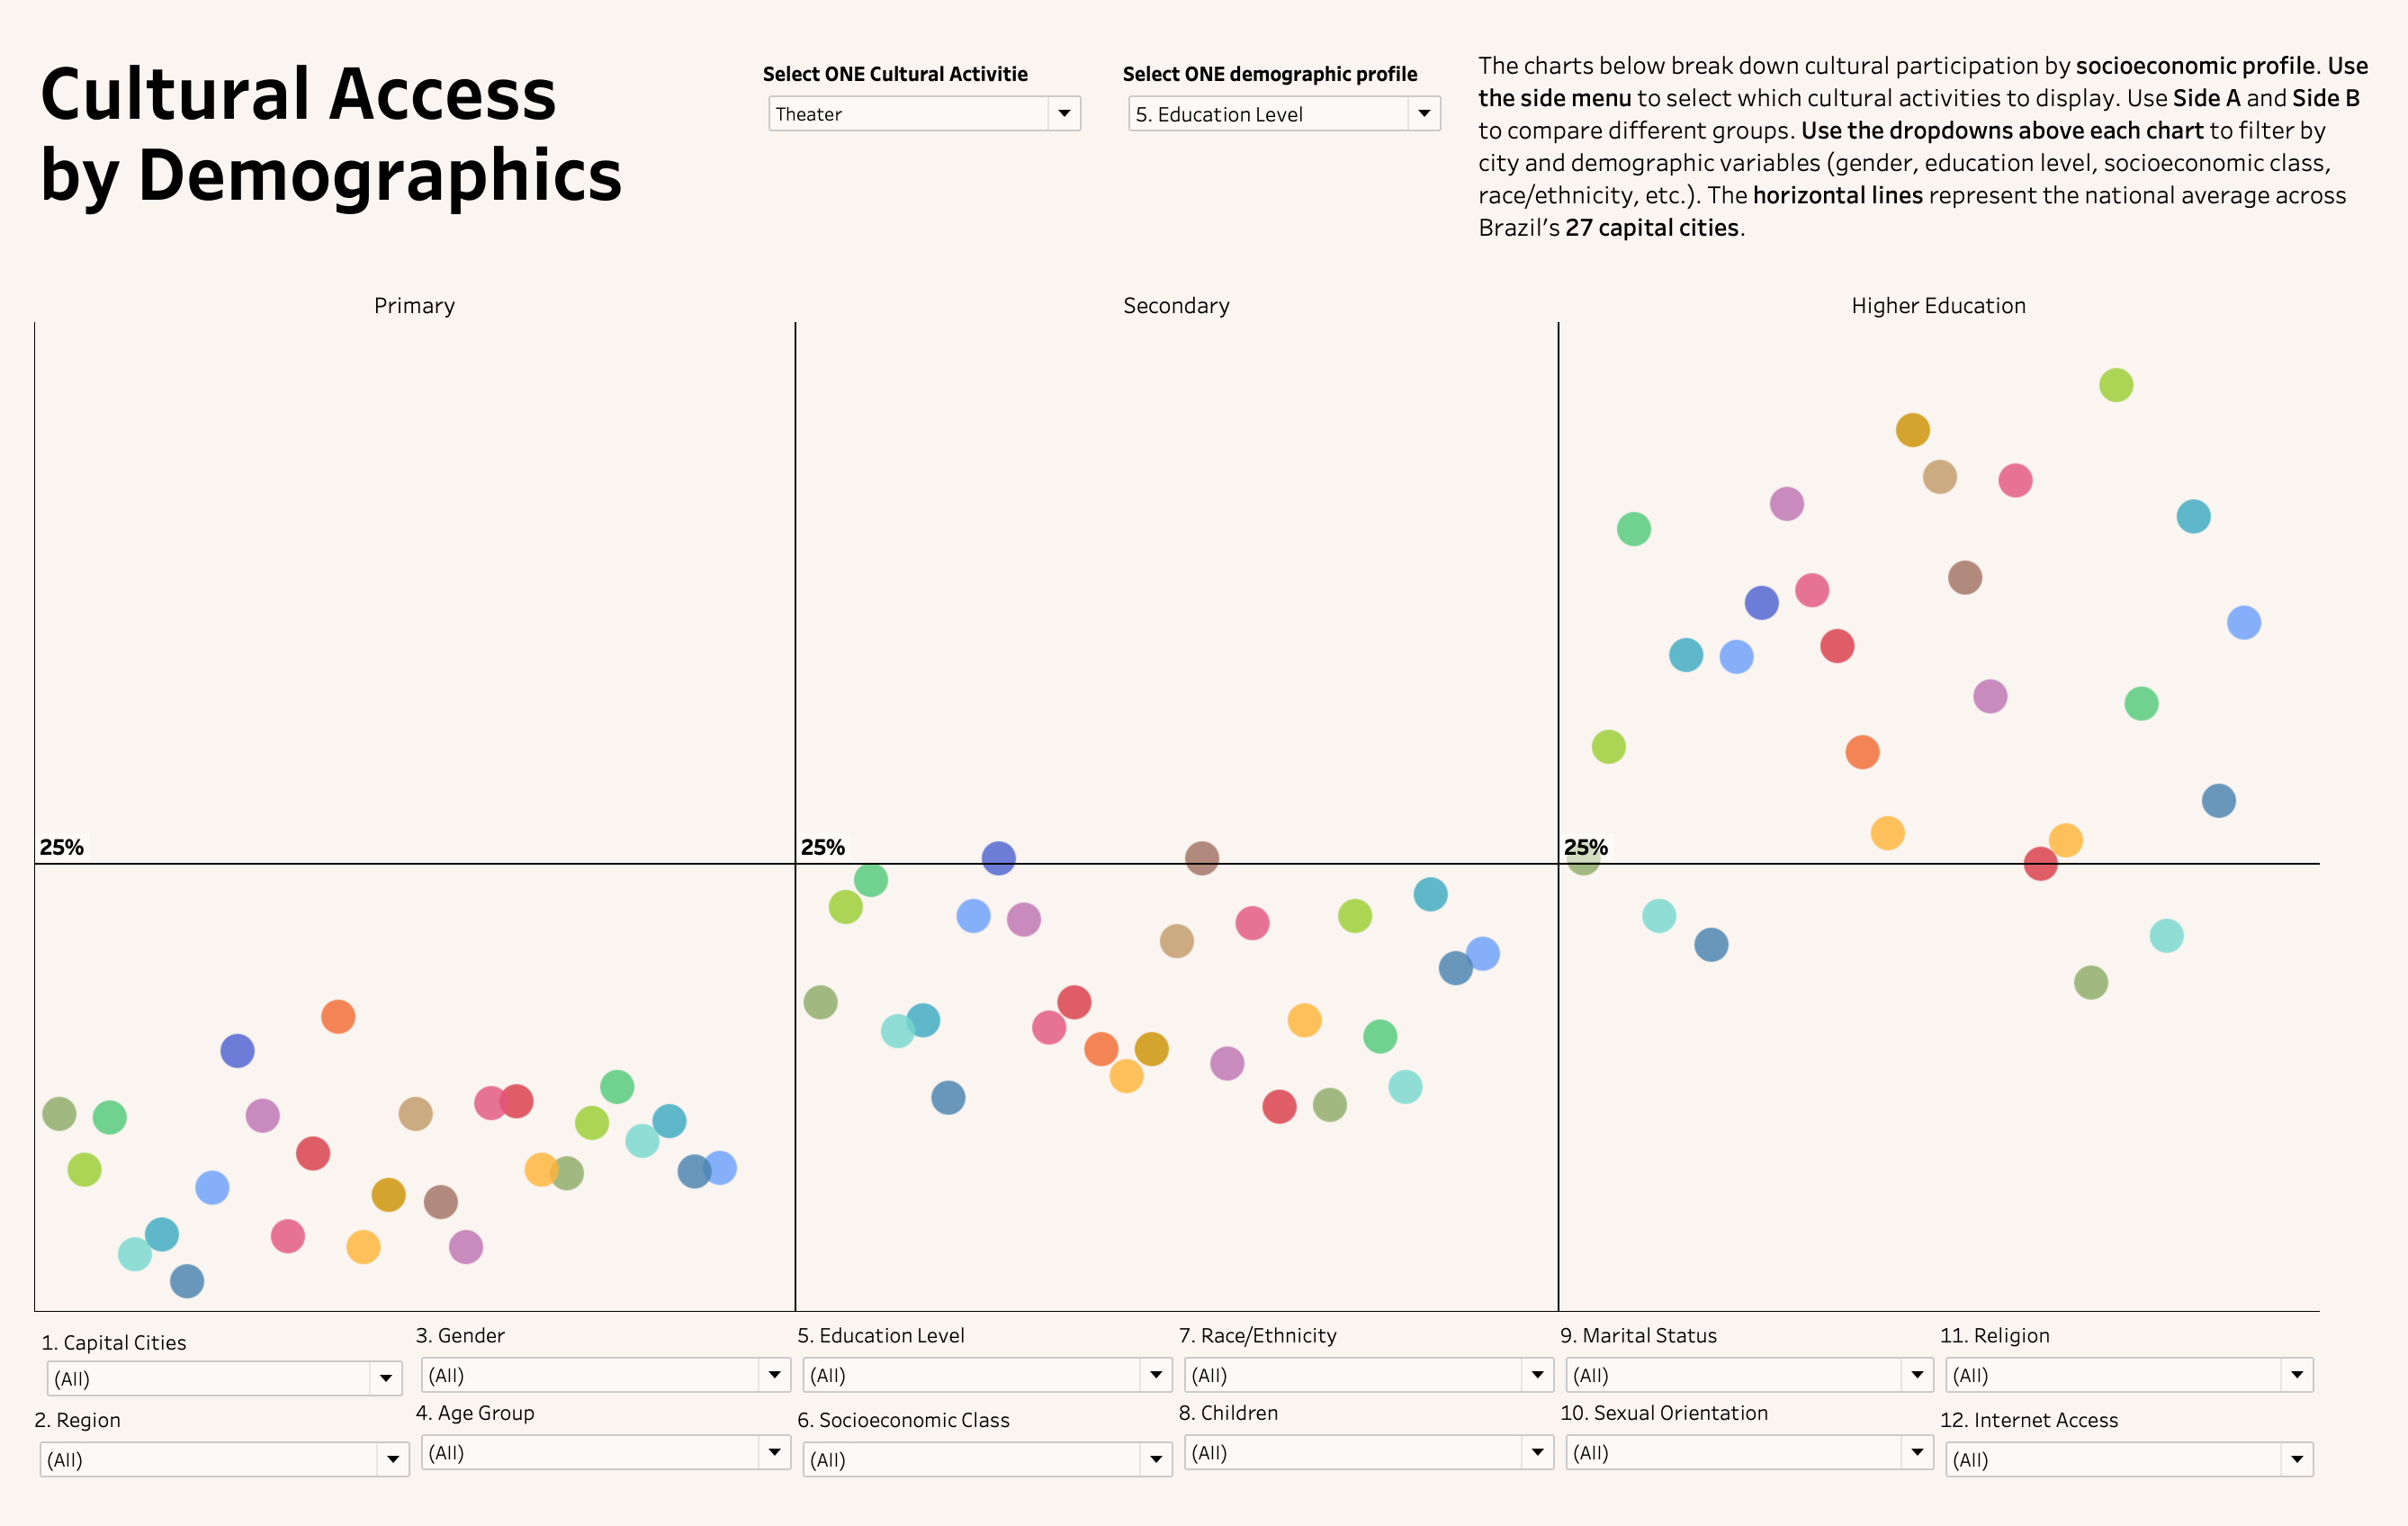
View comparing cultural participation in theater across education levels, showing how engagement shifts from primary to higher education across all 27 capitals.
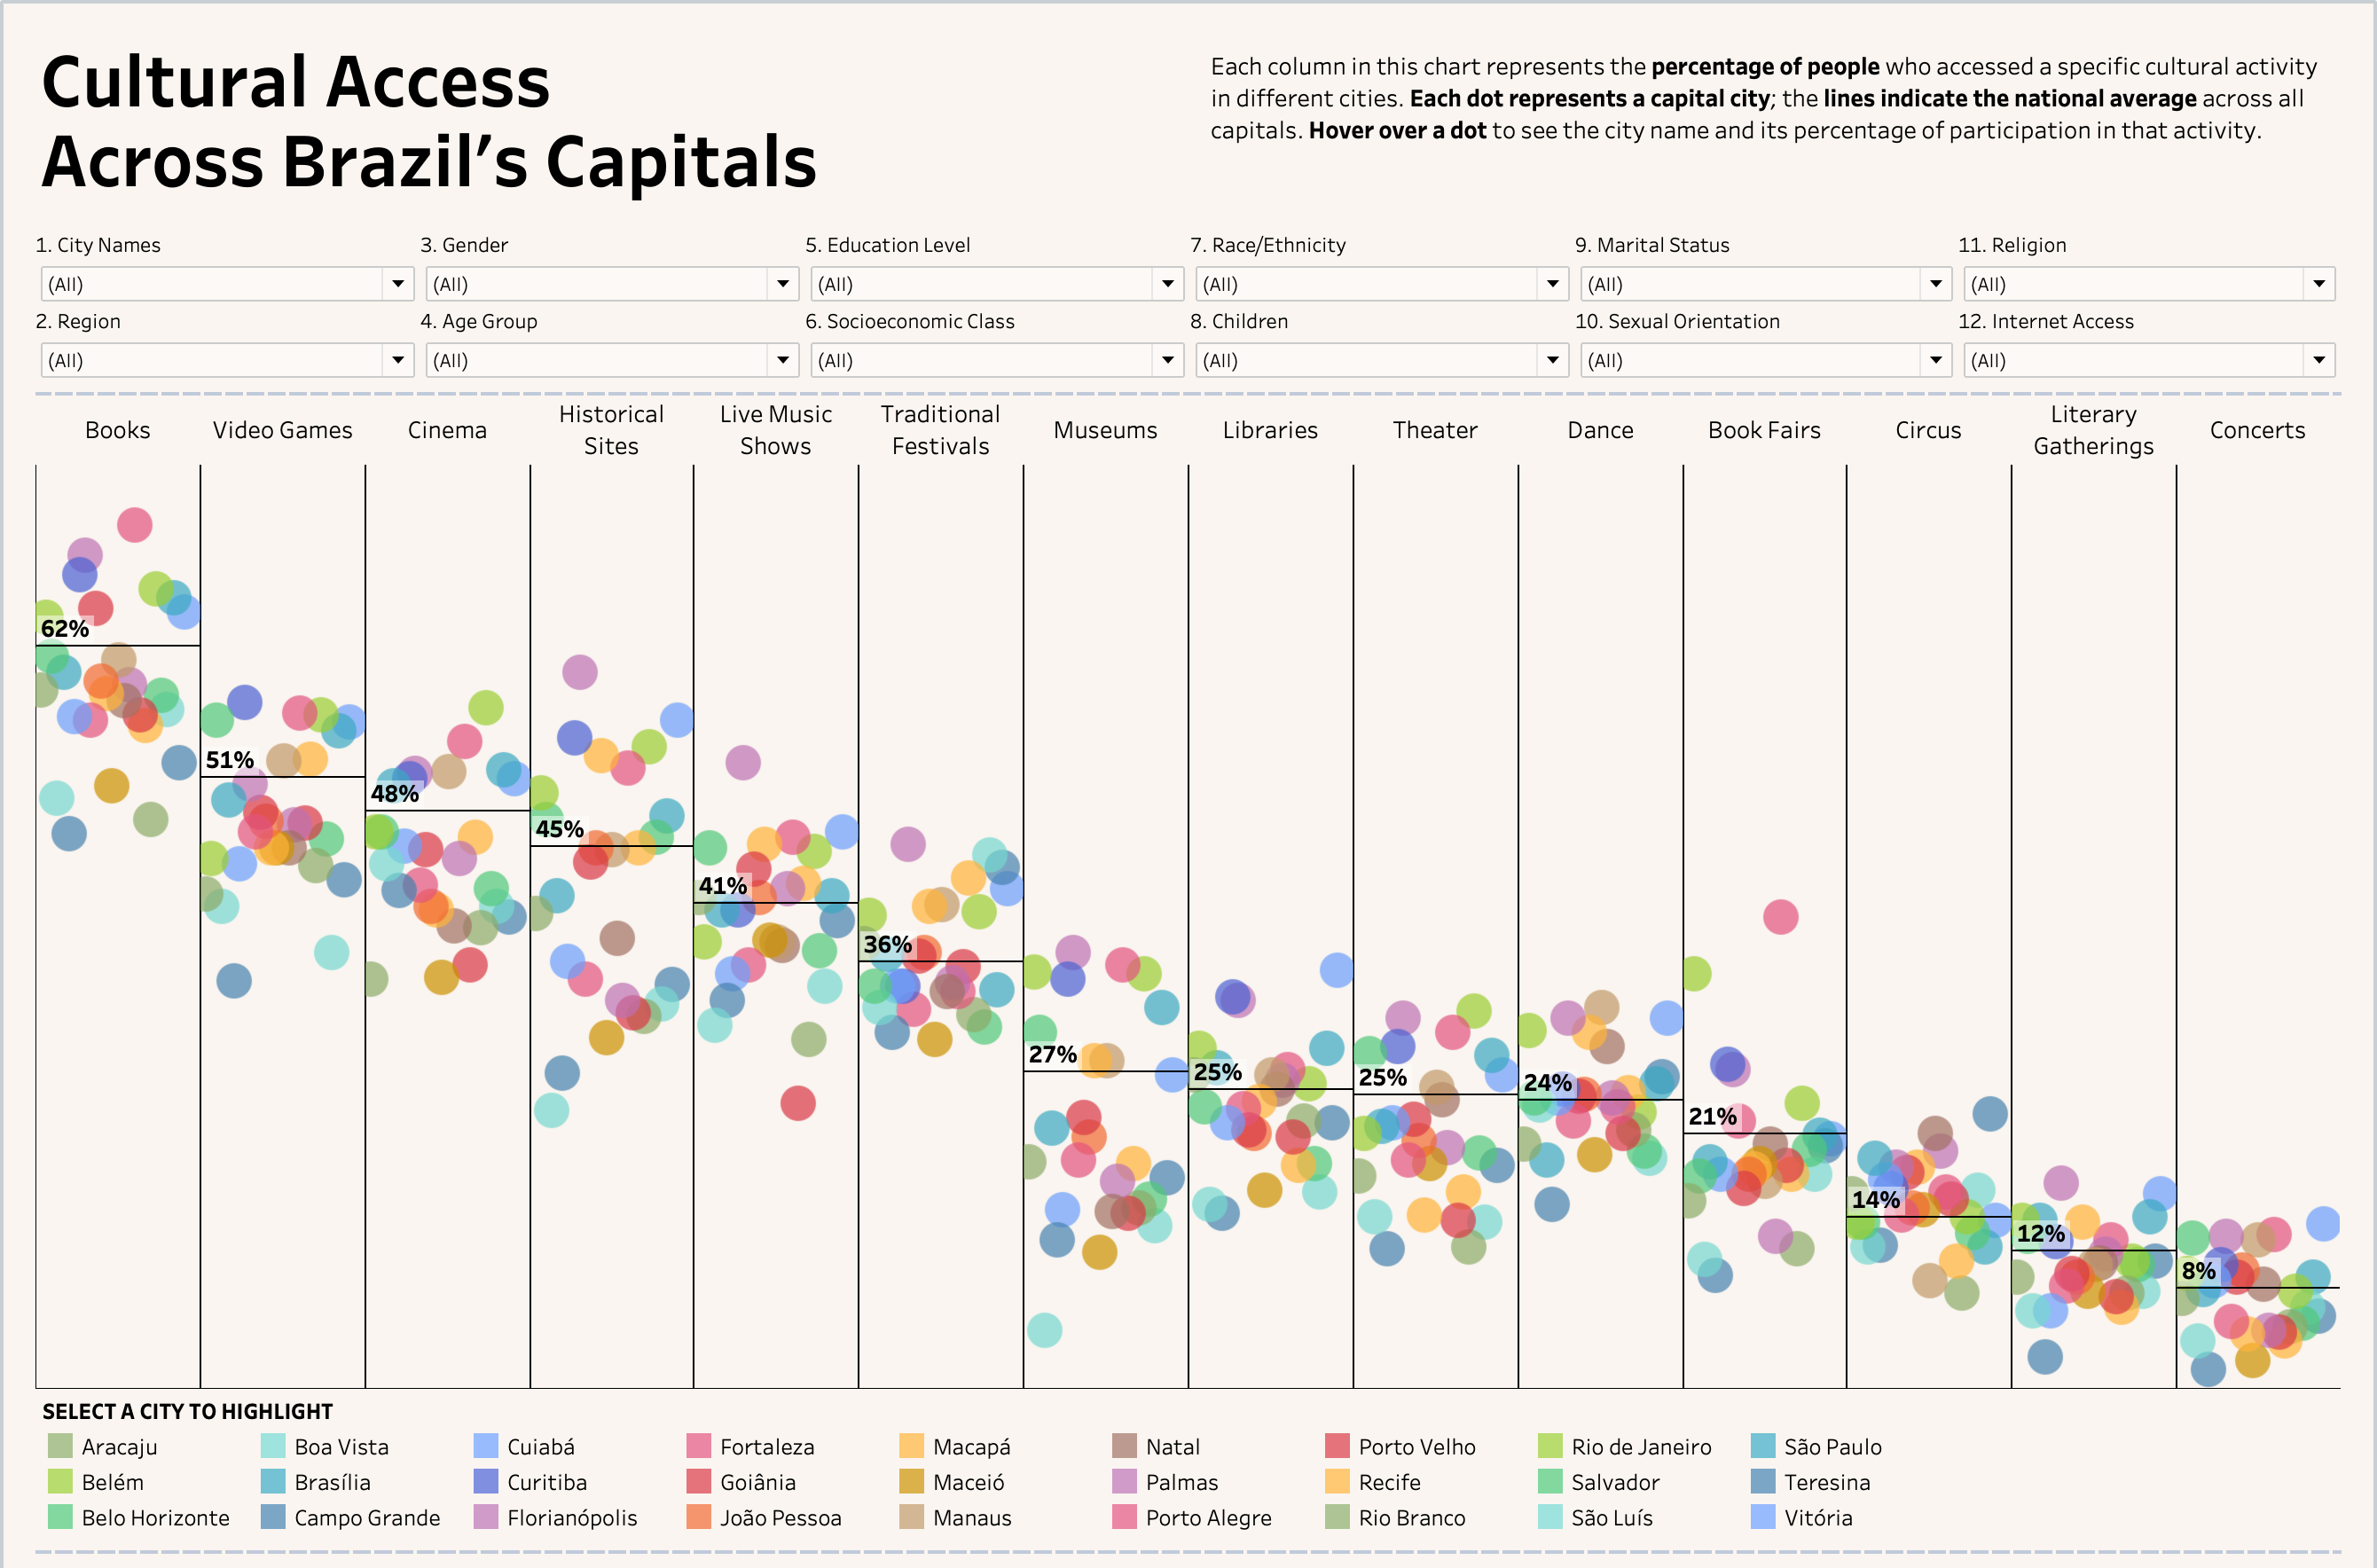
View of cultural participation across Brazil’s 27 capitals, with each dot representing a city and columns comparing engagement rates for 14 activities. Median averages indicate which cities are above or below the national trend, while 12 socioeconomic filters allow users to drill deeper into the data.
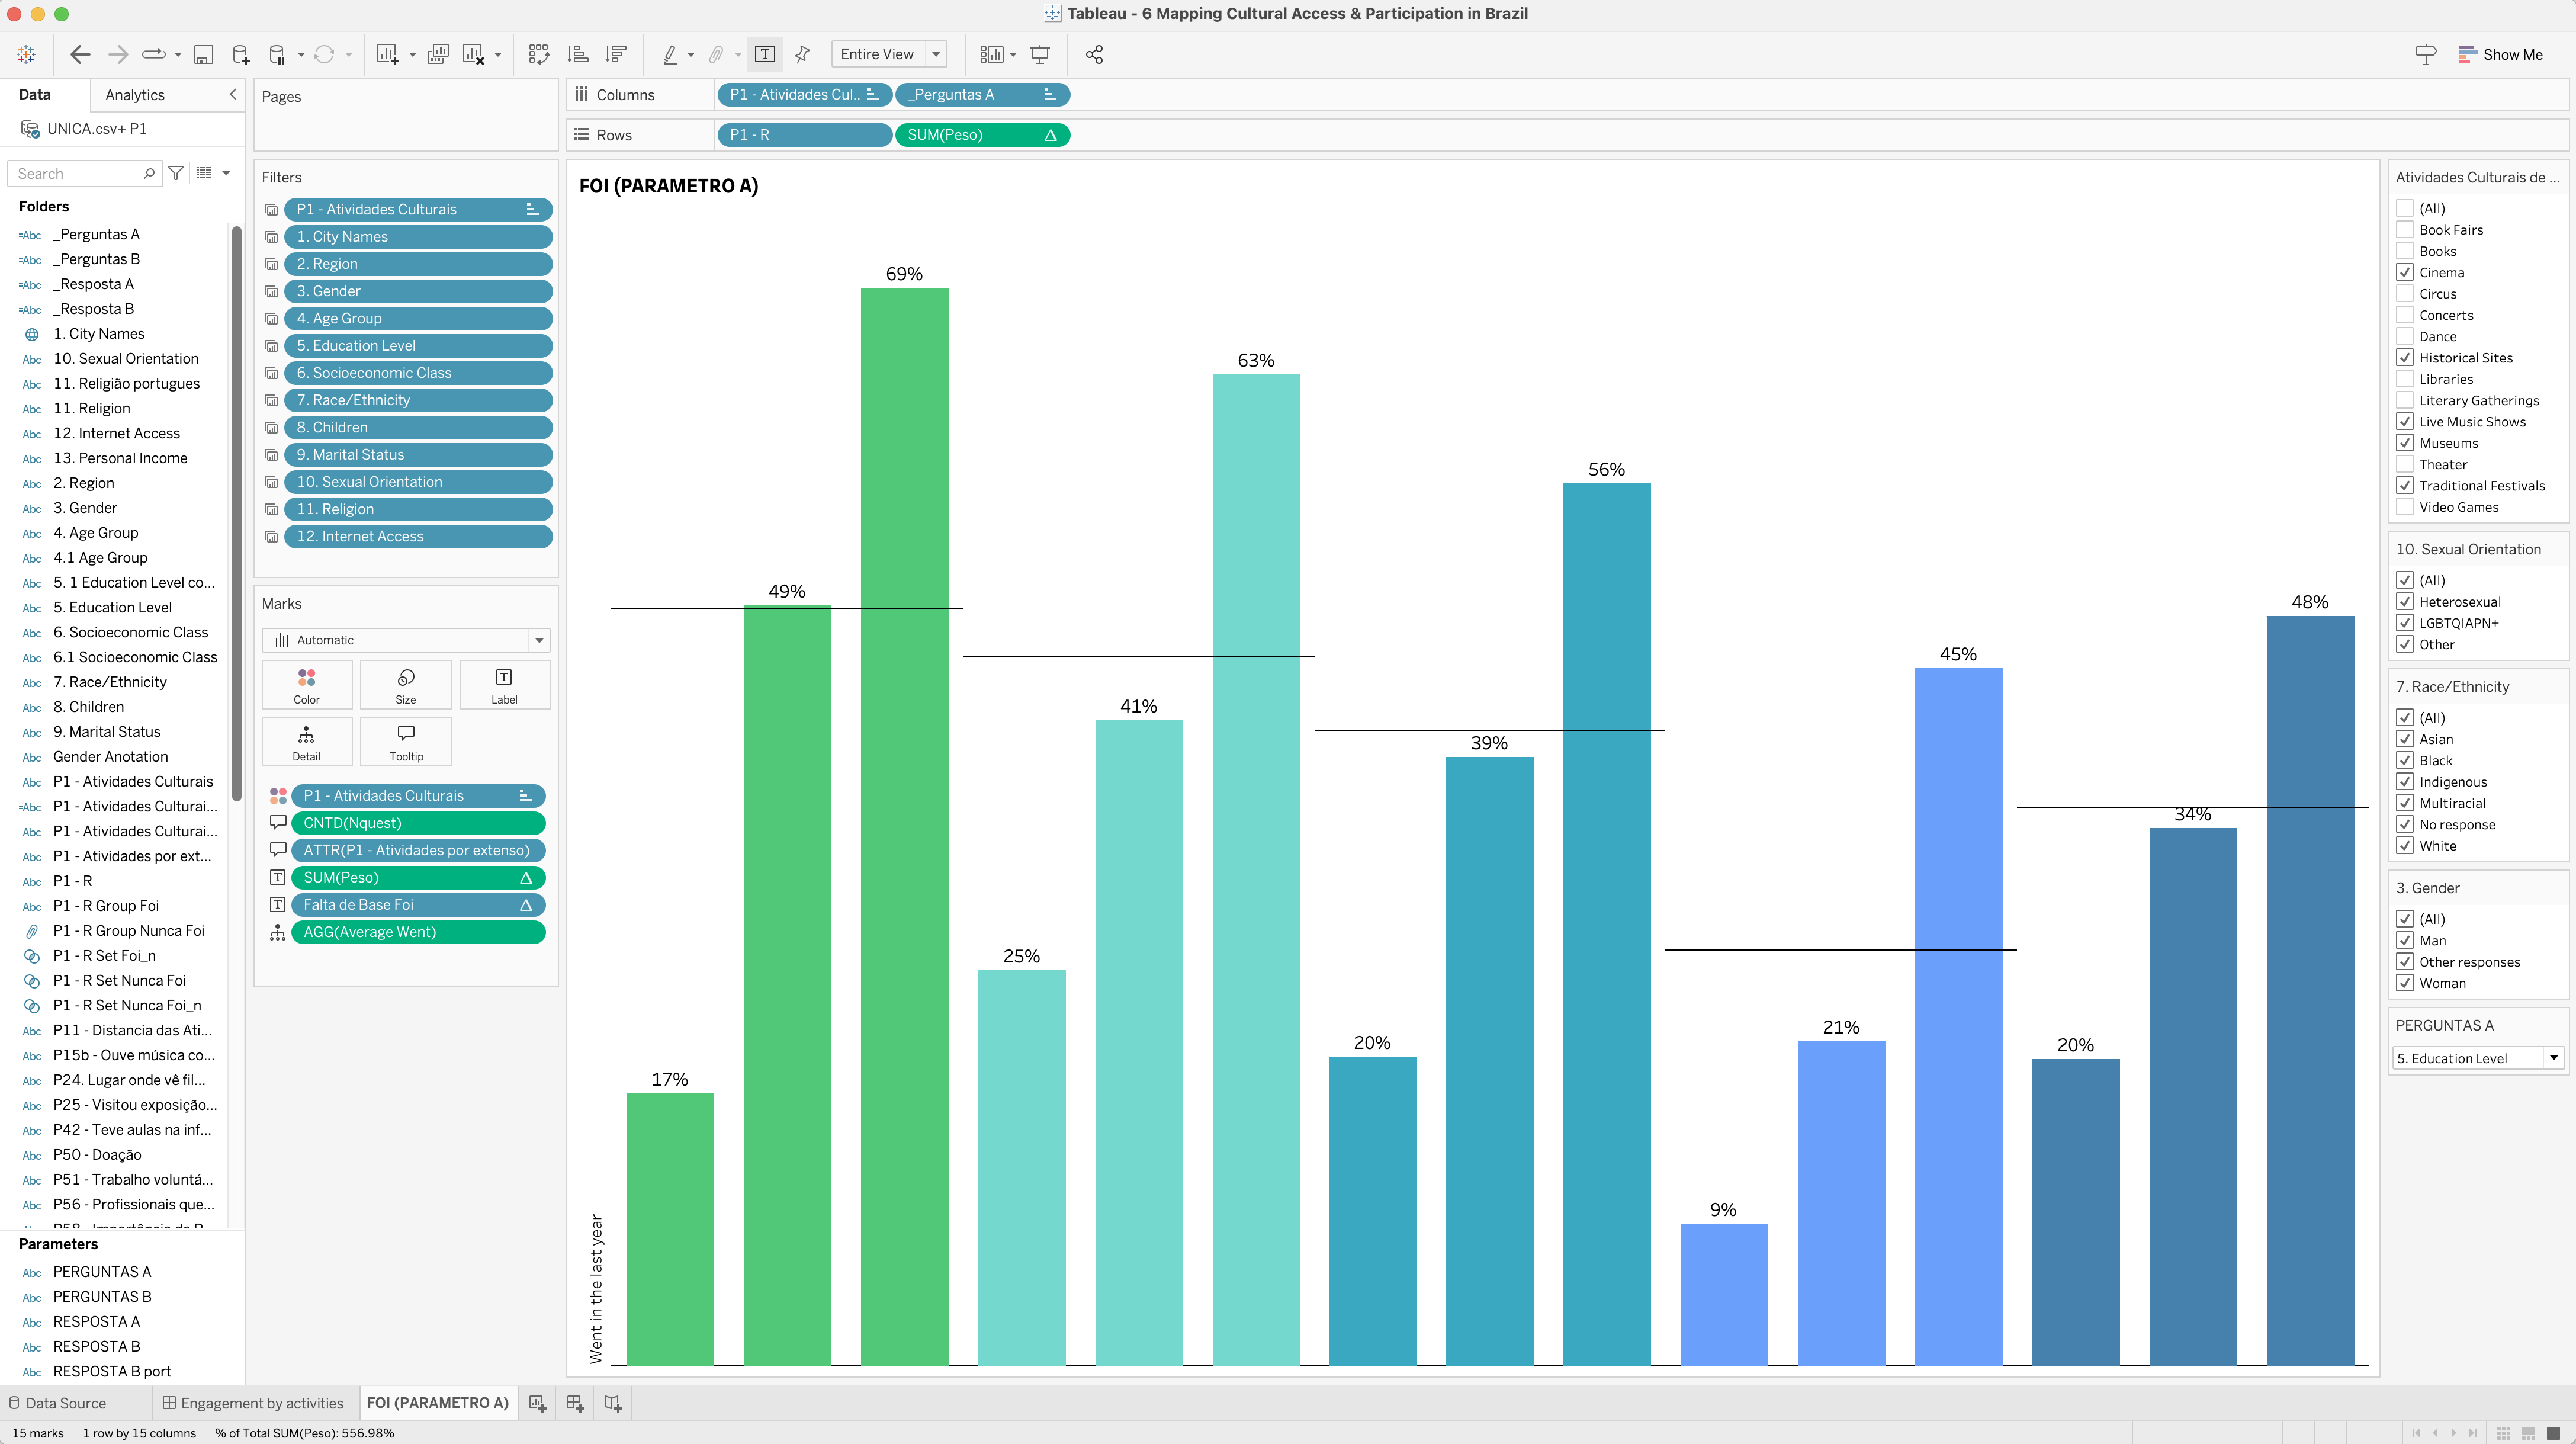
Technical view of the Tableau workbook, illustrating how parameters and filters are applied to compare cultural participation across demographics.
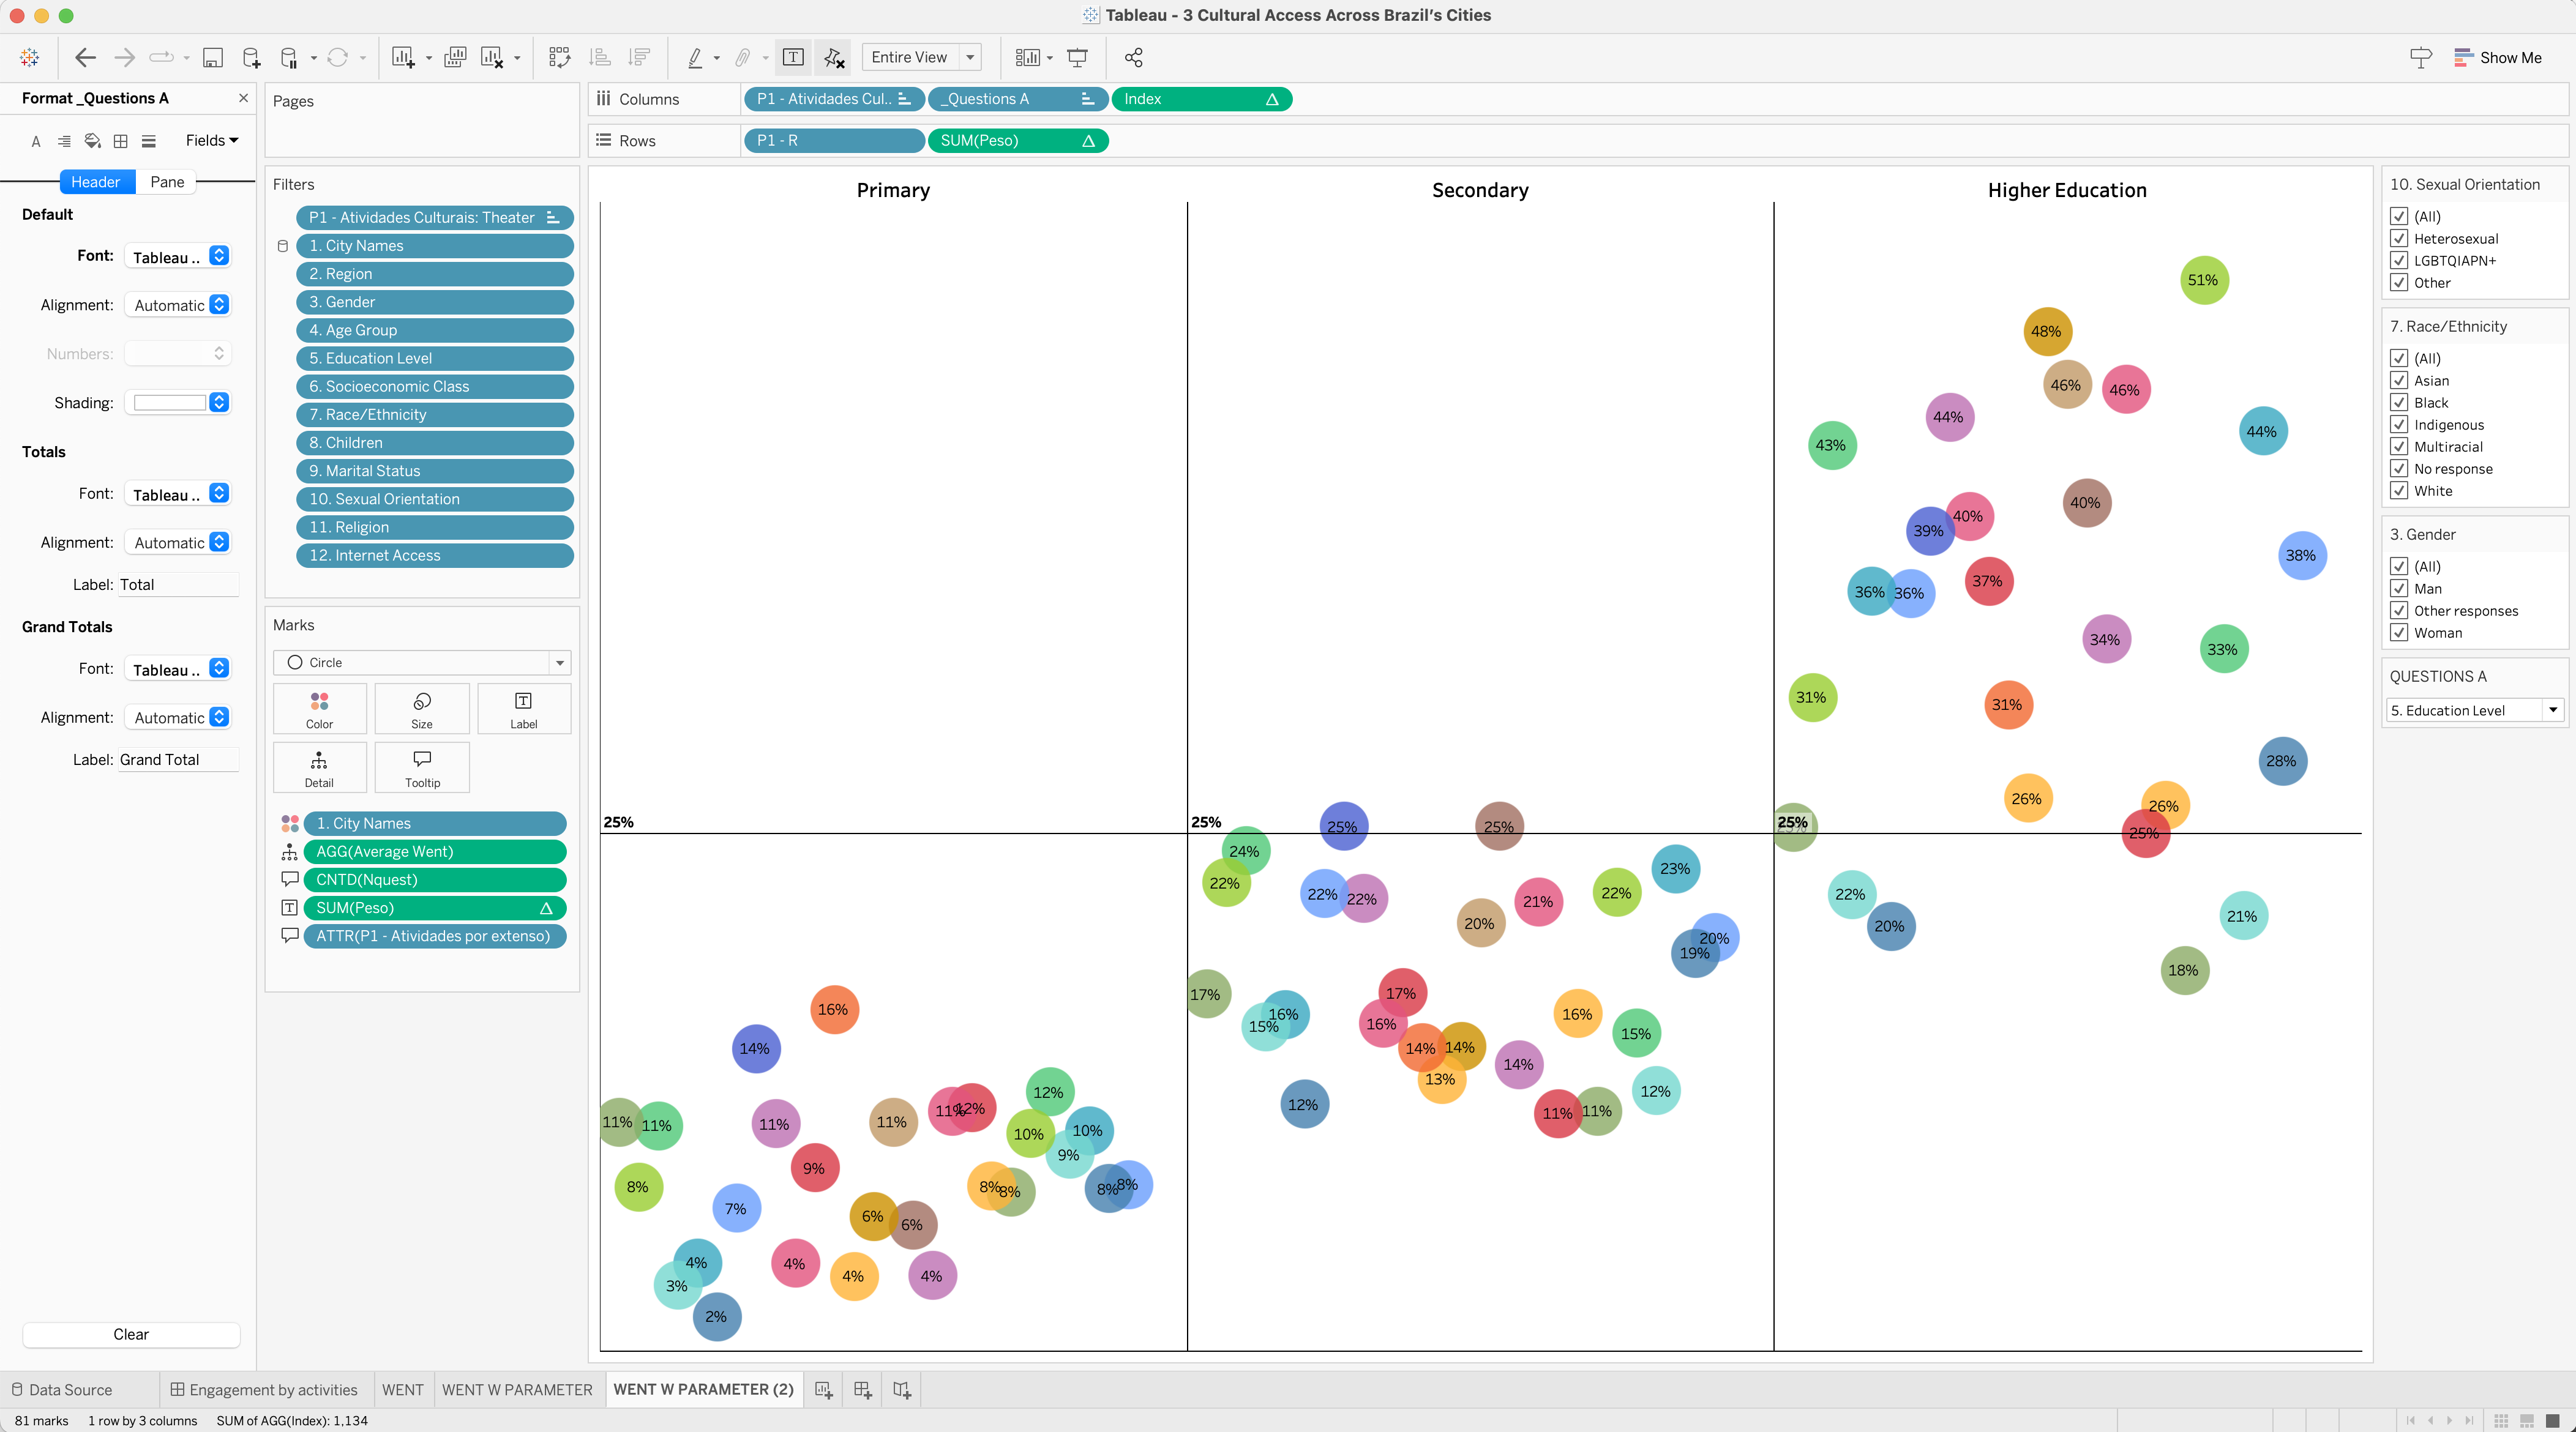
Another technical view of the workbook, illustrating parameters and filters.
Public seminars held in all 27 capitals, where dashboards and report slides translated the data into clear narratives and open Q&A sessions encouraged public debate on cultural access.
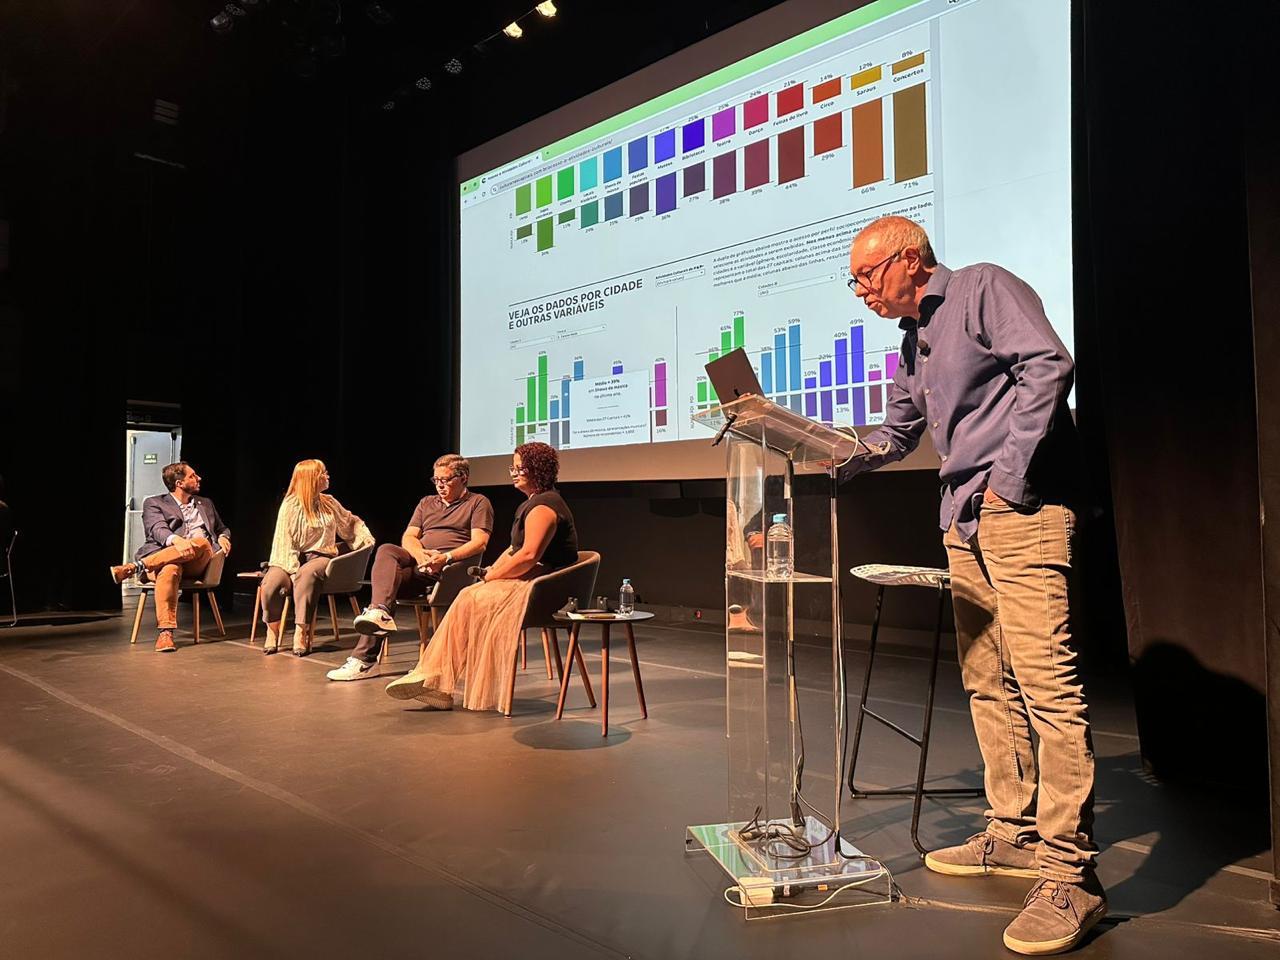
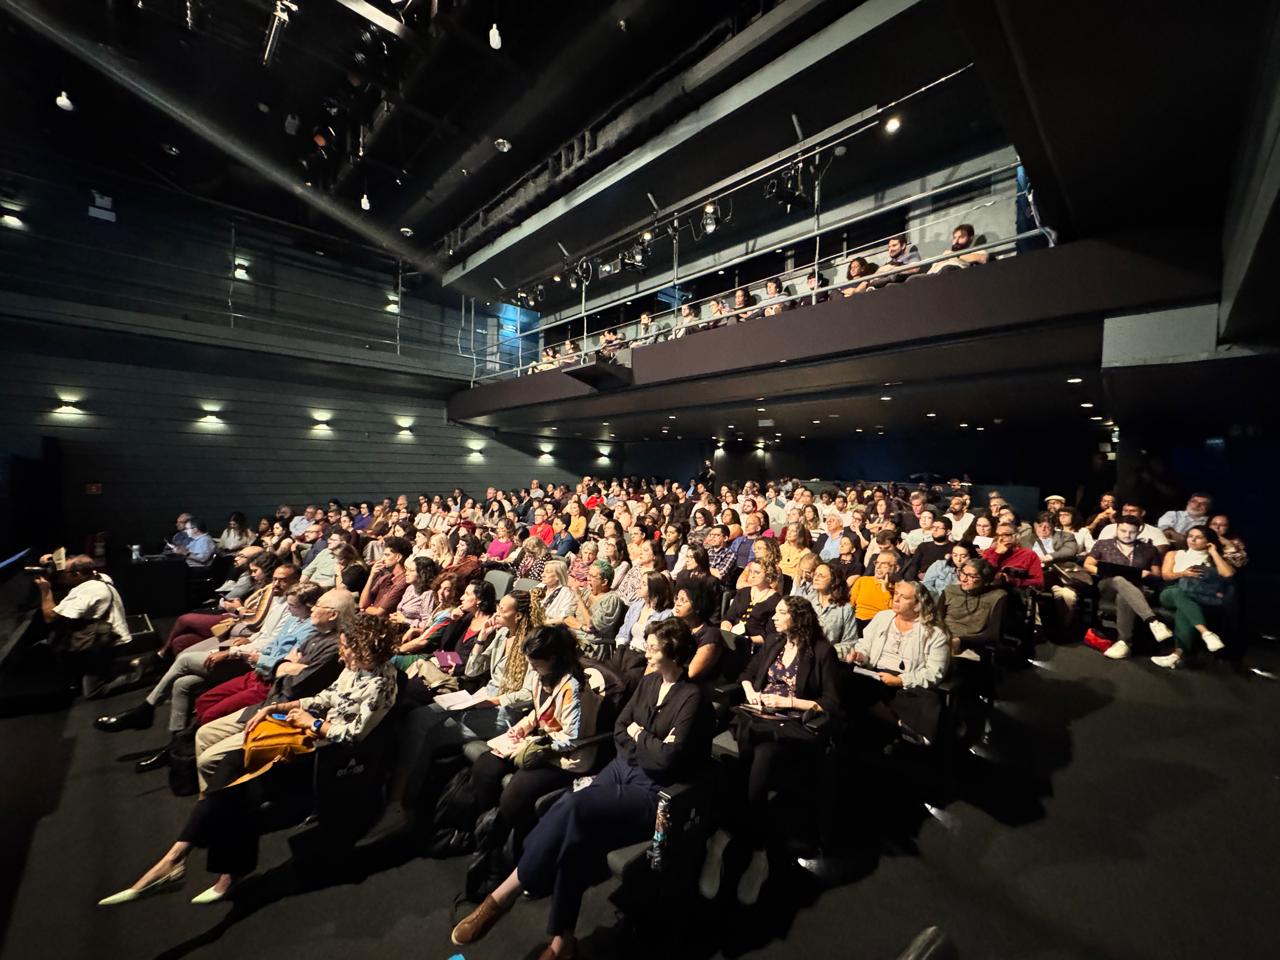
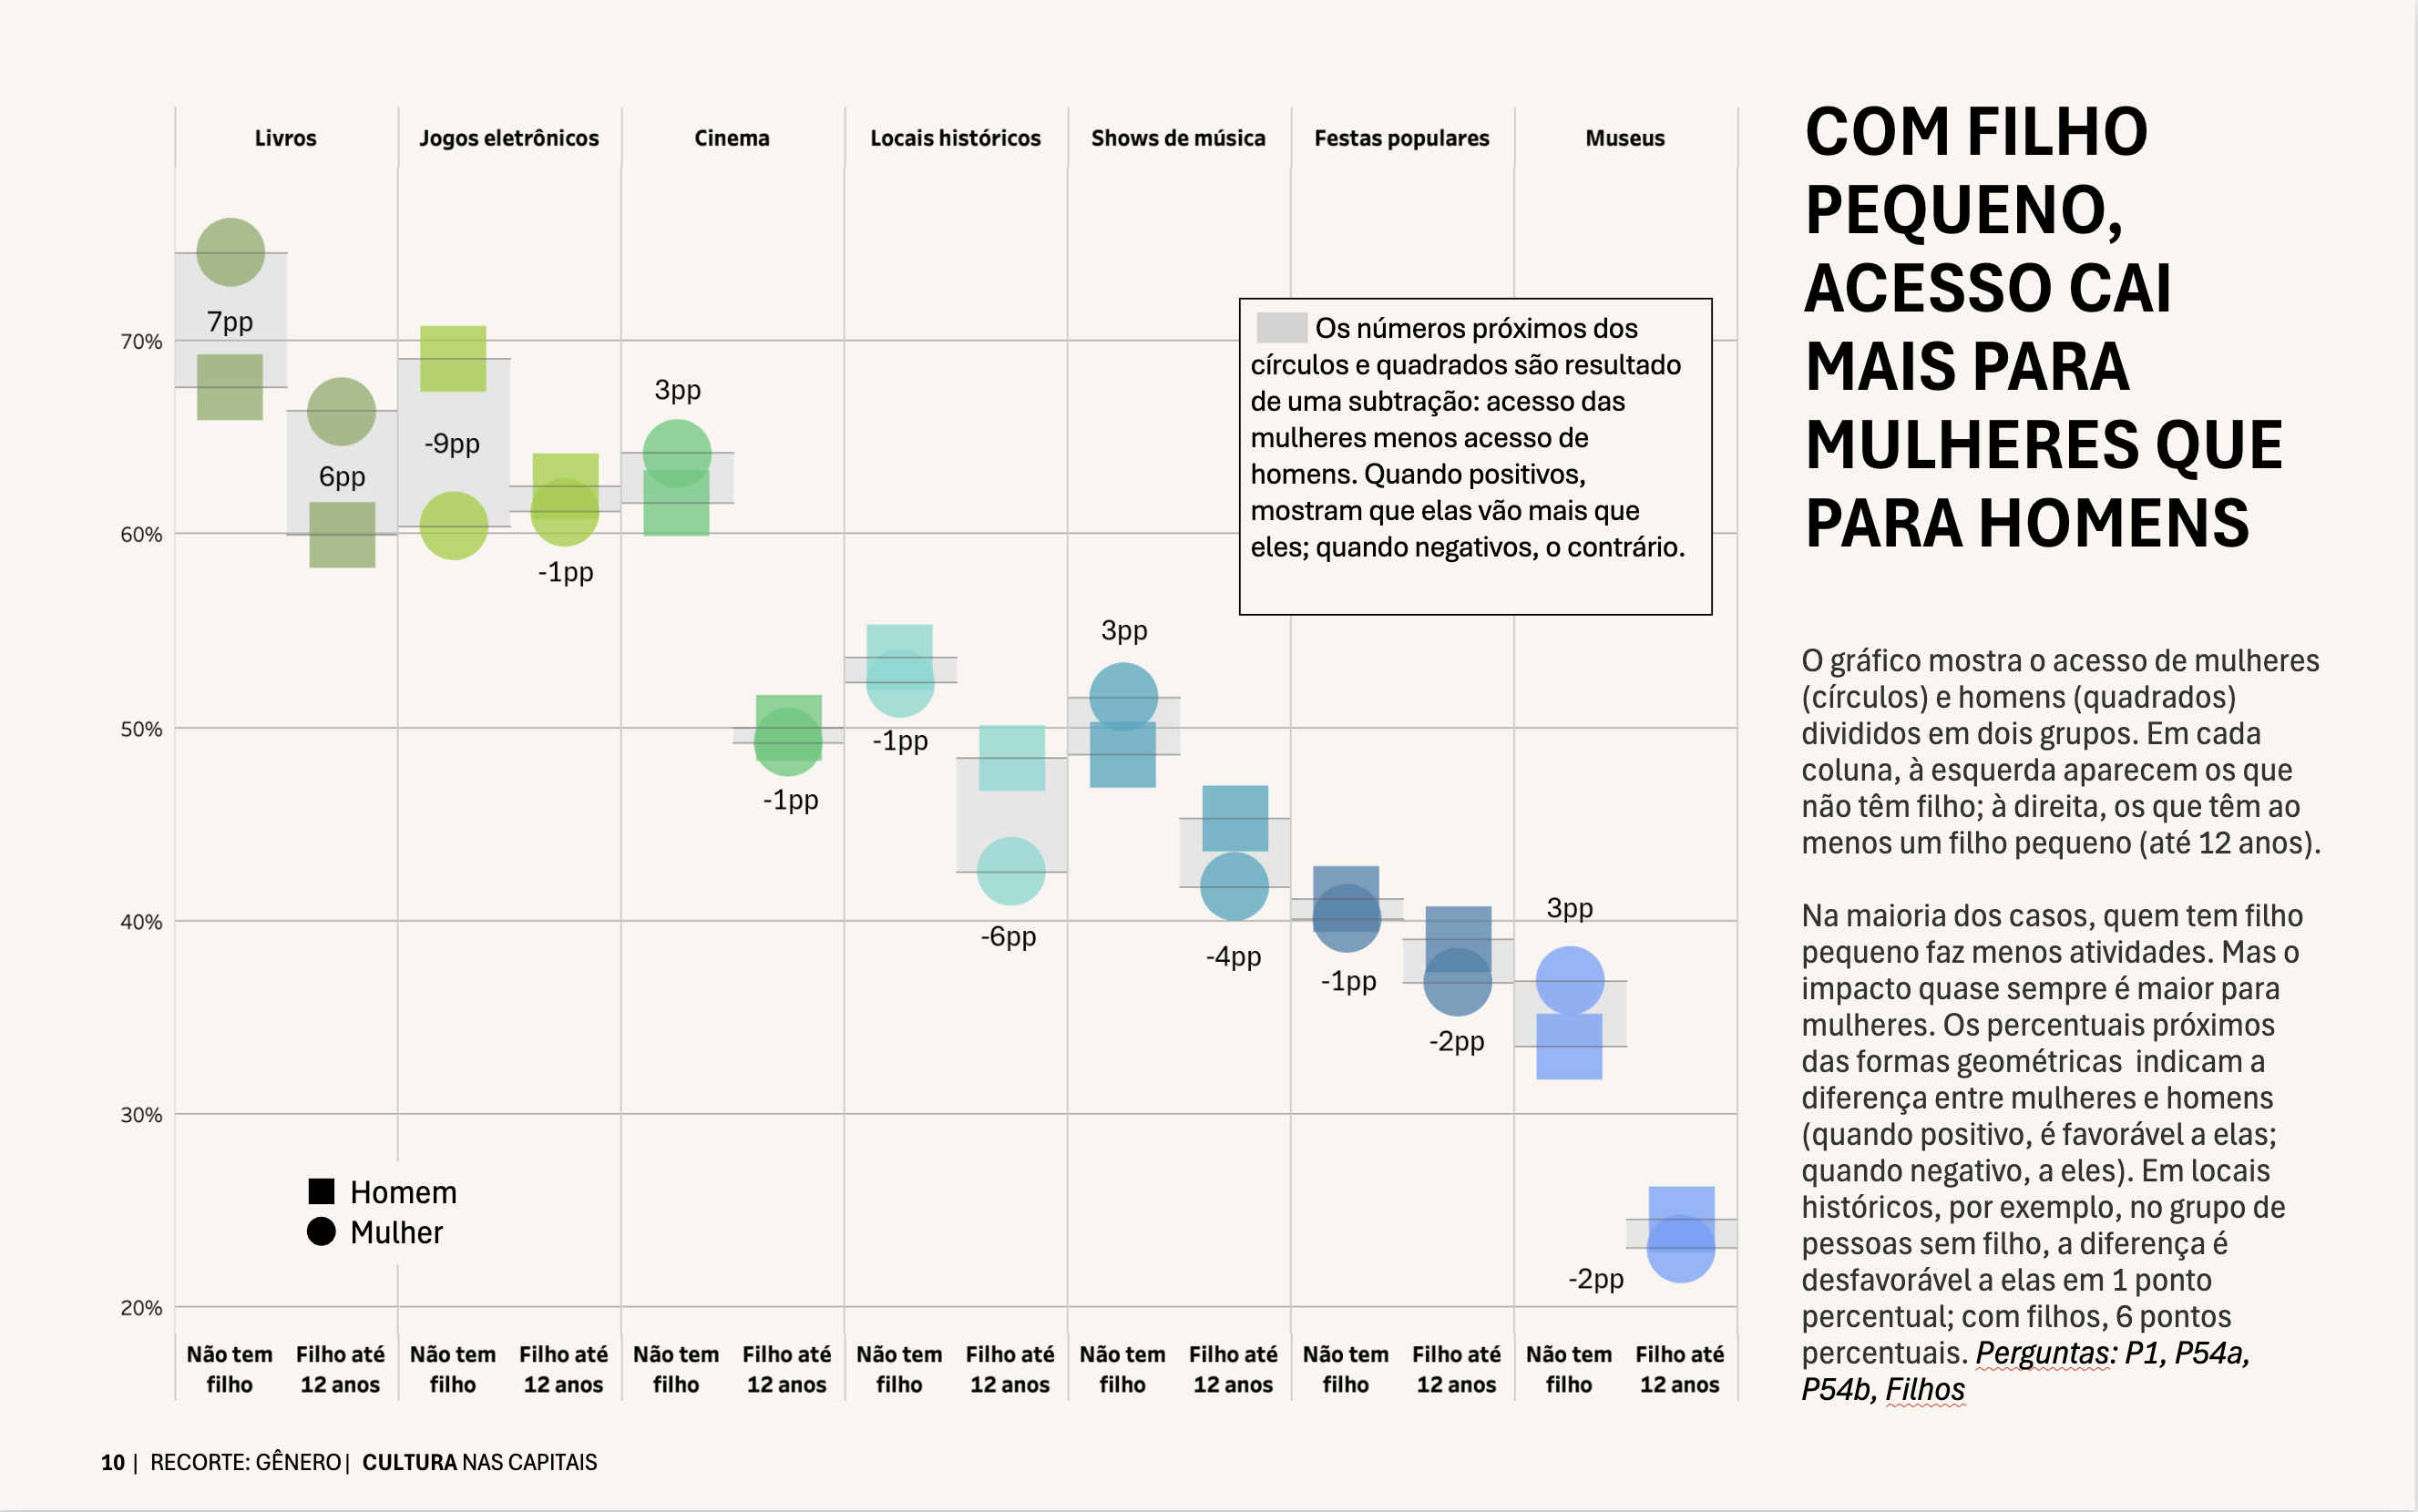
Chart comparing cultural participation of men (squares) and women (circles) with and without young children. The data shows that having a child under 12 reduces cultural access for both, but the drop is consistently greater for women.
CHALLENGE
The largest cultural engagement survey ever conducted in Brazil set out to analyze audience participation, access barriers, and the role of socioeconomic factors in cultural consumption across all 27 Brazilian capitals. This ambitious study, based on 19,500 in-person interviews and nearly 500 data points per respondent, required a scalable and accessible data visualization system to serve researchers, policymakers, cultural institutions, and entrepreneurs. The challenge was to transform a massive dataset into clear, engaging, and actionable insights—both for public access and for in-depth academic and policy discussions.
ROLE
Data Visualization Designer, Dashboard Developer and Data Modeling
SOLUTION
To make this extensive dataset accessible and impactful, I developed a comprehensive data visualization system that combined ETL processes, data modeling, and interactive reporting. The first step was structuring the raw data, ensuring consistency and usability by refining thousands of data points for efficient analysis. With a focus on data storytelling, I designed interactive dashboards that allowed users to explore cultural habits across various dimensions, including region, economic class, education level, and accessibility.
Beyond the dashboards, the project required strategic information design to translate findings into compelling, easy-to-understand reports and presentations. These materials were tailored for public in-person seminars in all 27 capitals, fostering discussions on education, investment, and social disparities in Brazil’s cultural landscape.
IMPACT
nationwide discussions on public investment, cultural accessibility, and the intersection of culture with social and economic structures. The data presentations have filled auditoriums across the country, demonstrating a strong demand for insights into cultural engagement. Beyond live events, the survey’s findings remain accessible through downloadable reports and interactive dashboards, ensuring its influence extends far beyond its initial release. The project is already reshaping policy conversations and providing a critical resource for future cultural development initiatives.
