CHALLENGE
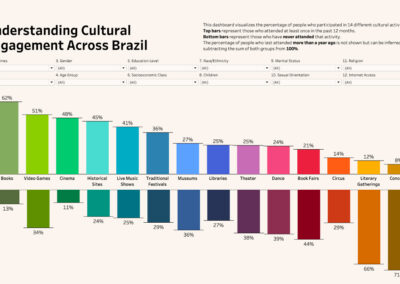
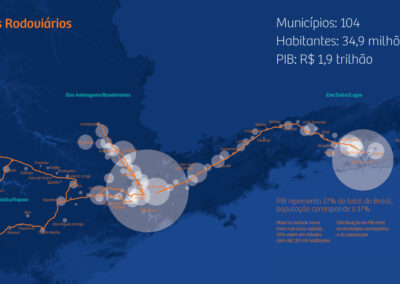
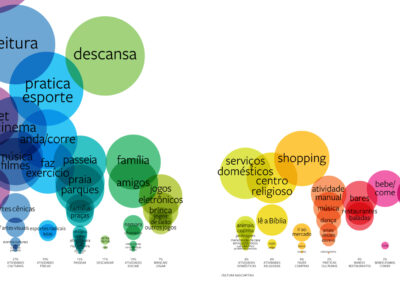
The Rotas da Cultura project mapped cultural infrastructure and public funding across 104 cities along three major highways connecting São Paulo and Rio de Janeiro. The challenge was to structure and visualize this vast dataset to provide meaningful insights into cultural spaces, resources, and regional disparities.
ROLE
Data Visualization Designer
SOLUTION
As the Data Visualization Designer, I transformed complex datasets into interactive, user-friendly visual formats. Collaborating with Bruno Lemgruber and Marcelo Torrico, I developed dynamic maps that enabled users to explore cultural spaces, public spending, and local resources. The project culminated in a comprehensive book and an interactive website, where users could access city data alphabetically by GDP per capita, population size, and cultural characteristics. Additionally, a highway-based navigation system allowed users to explore cities through interactive maps, with markers reflecting their population size and cultural significance.
IMPACT
Rotas da Cultura set a new benchmark for data transparency in Brazil’s cultural sector, making critical insights accessible to policymakers, cultural institutions, and the public. The visual tools developed were praised for enhancing user engagement and informing cultural policies and initiatives. By providing a structured, interactive view of cultural infrastructure, the project contributed to a deeper understanding of regional cultural dynamics and resource distribution.